Which one of the following graph is correct at constant pressure?


The correct Answer is:A
To determine which graph represents a situation at constant pressure, we can analyze the relationship between volume (V) and temperature (T) based on the ideal gas law, which states:
PV=nRT
Where:
- P = Pressure
- V = Volume
- n = Number of moles of gas
- R = Ideal gas constant
- T = Temperature
1. Understand the Ideal Gas Law:
The ideal gas law relates pressure, volume, and temperature. For a constant pressure scenario, we can rearrange the equation to show the relationship between volume and temperature:
V∝T(at constant P)
2. Analyze the Graphs:
We need to look for a graph that shows a direct proportionality between volume and temperature. This means if we plot volume (V) against temperature (T), we should see a linear relationship.
3. Check Option A:
In option A, the graph plots VT on the y-axis against 1V on the x-axis. If VT is constant, it implies that as 1V changes, V must adjust in such a way that V remains proportional to T. Thus, this indicates that pressure is constant.
4. Conclusion:
Since option A shows that V is directly proportional to T at constant pressure, we conclude that option A is the correct graph representing a constant pressure scenario.
Final Answer:
The correct graph at constant pressure is Option A.
---
- P = Pressure
- V = Volume
- n = Number of moles of gas
- R = Ideal gas constant
- T = Temperature
The ideal gas law relates pressure, volume, and temperature. For a constant pressure scenario, we can rearrange the equation to show the relationship between volume and temperature:
V∝T(at constant P)
We need to look for a graph that shows a direct proportionality between volume and temperature. This means if we plot volume (V) against temperature (T), we should see a linear relationship.
In option A, the graph plots VT on the y-axis against 1V on the x-axis. If VT is constant, it implies that as 1V changes, V must adjust in such a way that V remains proportional to T. Thus, this indicates that pressure is constant.
Since option A shows that V is directly proportional to T at constant pressure, we conclude that option A is the correct graph representing a constant pressure scenario.
The correct graph at constant pressure is Option A.
Topper's Solved these Questions
- KINETIC THEORY OF GASES AND RADIATION BOOK - TARGET PUBLICATIONCHAPTER - KINETIC THEORY OF GASES AND RADIATION EXERCISE - Evaluation test
18 Videos
- KINETIC THEORY OF GASES AND RADIATION BOOK - TARGET PUBLICATIONCHAPTER - KINETIC THEORY OF GASES AND RADIATION EXERCISE - critical thinking
104 Videos
- INTERFERENCE AND DIFFRACTIONBOOK - TARGET PUBLICATIONCHAPTER - INTERFERENCE AND DIFFRACTIONEXERCISE - EVALUATION TEST
20 Videos
- MAGNETIC EFFECT OF ELECTRIC CURRENTBOOK - TARGET PUBLICATIONCHAPTER - MAGNETIC EFFECT OF ELECTRIC CURRENTEXERCISE - EVALUATION TEST
19 Videos
Similar Questions
Knowledge Check
Which of the following graph is correct
A_2019_CBT6_E01_019_O01.png) B
B_2019_CBT6_E01_019_O02.png) C
C_2019_CBT6_E01_019_O03.png) D
D_2019_CBT6_E01_019_O04.png)
Which of the following graph is correct?
A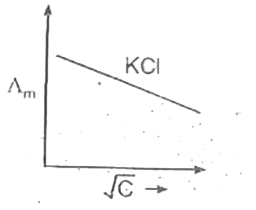 B
B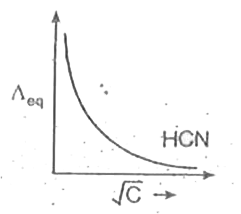 C
C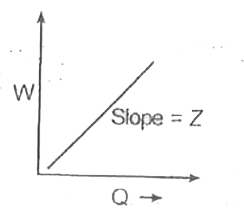 DAll of these
Which of the following graphs is/are correct.
A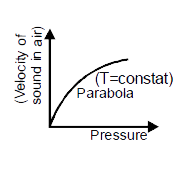 B
B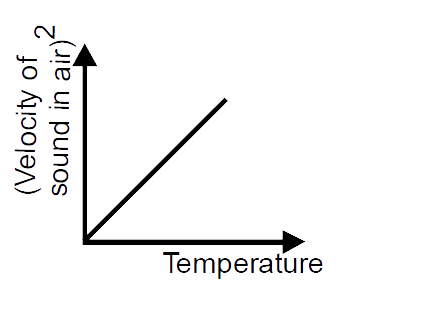 C
C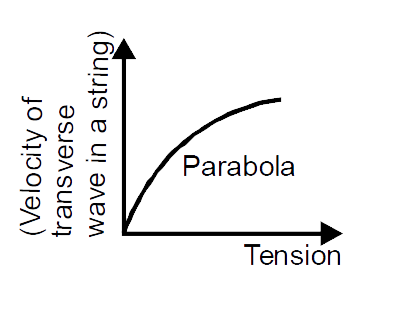 D
D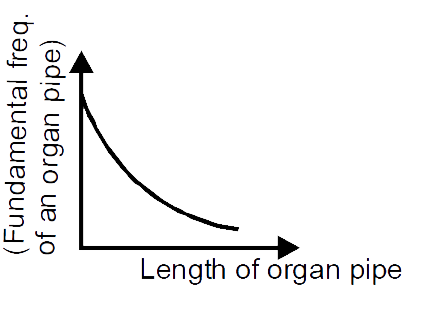
Which of the following graph is correct for a first order reaction ?
View SolutionWhich of the following graph is correct for a first order reaction ?
View SolutionWhich of the following graphs is correct for a first order reaction?
View SolutionWhich of the following graphs is correct for second order reaction ?
View SolutionWhich of the following will give a linear plot at constant pressure ?
View Solution
