Which of the following graph is correct for a first order reaction ?
The correct Answer is:A, D
To determine the correct graph for a first-order reaction, we need to analyze the characteristics of first-order kinetics and how they relate to graphical representations.
1. Understanding the Kinetic Equation:
The kinetic equation for a first-order reaction is given by:
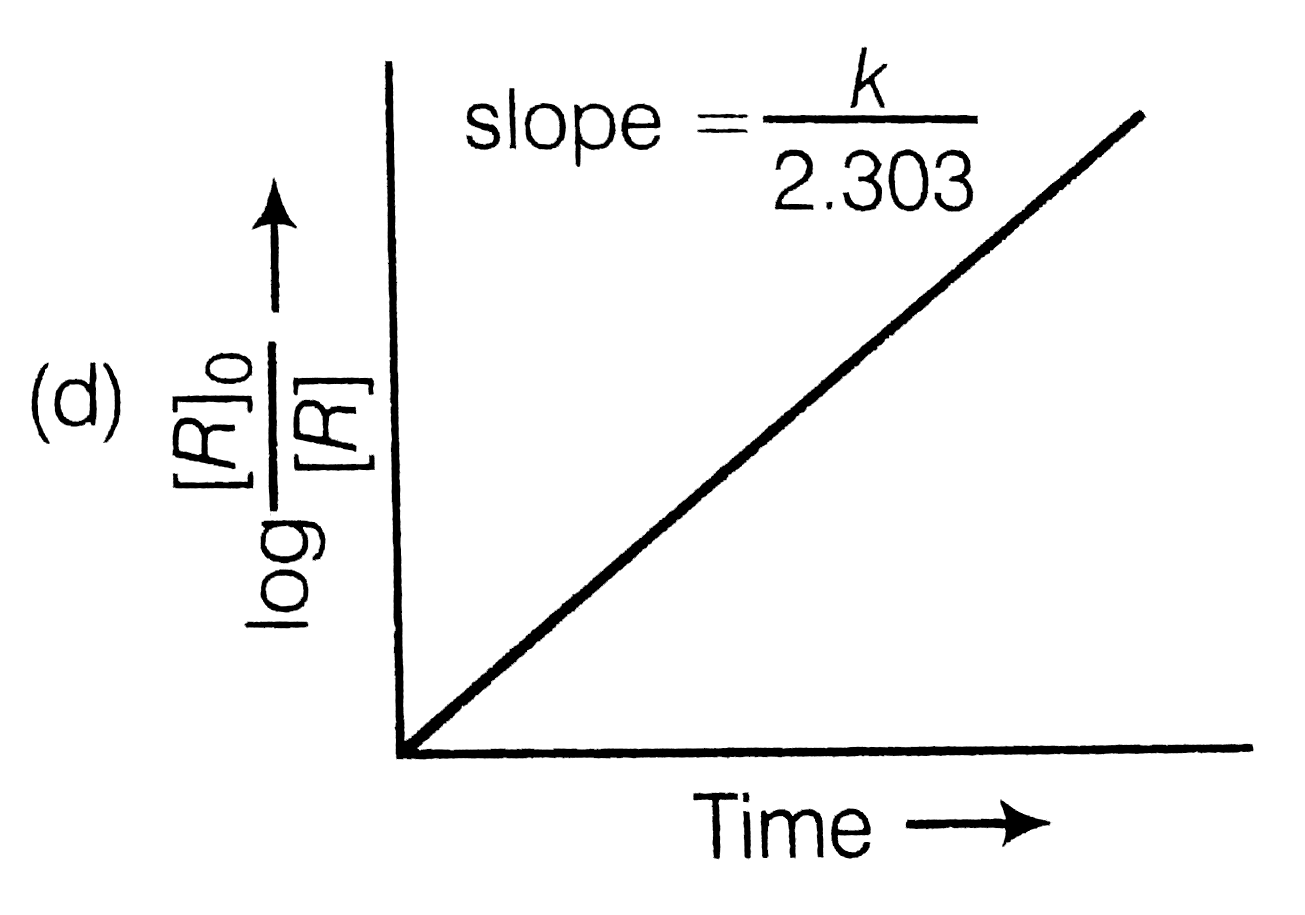
k=2.303tlog((A0)(A))
where:
- k is the rate constant,
- (A0) is the initial concentration,
- (A) is the concentration at time t.
2. Rearranging the Equation:
We can rearrange the equation to express it in the form of a straight line:
log(A0)−log(A)=k2.303t
This can be rewritten as:
log(A)=log(A0)−k2.303t
This is in the form y=mx+b, where:
- y=log(A),
- m=−k2.303 (the slope),
- x=t,
- b=log(A0) (the y-intercept).
3. Graph Characteristics:
The graph of a first-order reaction will be a straight line when plotting log(A) (y-axis) against time t (x-axis). The slope of this line will be negative, indicating that as time increases, the logarithm of the concentration decreases.
4. Identifying the Correct Graph:
Based on the analysis, we are looking for a graph that shows a straight line with a negative slope when log(A) is plotted against time t.
5. Half-Life of First-Order Reactions:
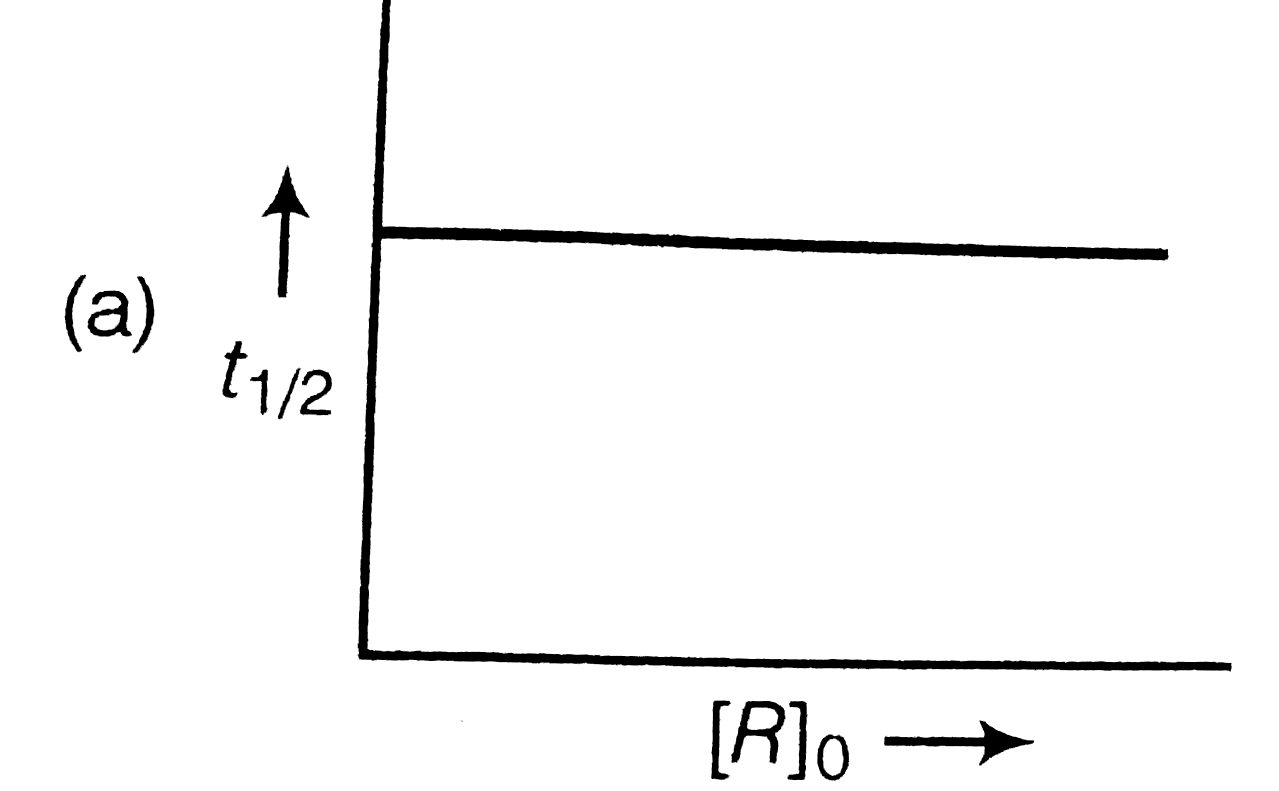
The half-life t1/2 for a first-order reaction is given by:
t1/2=0.693k
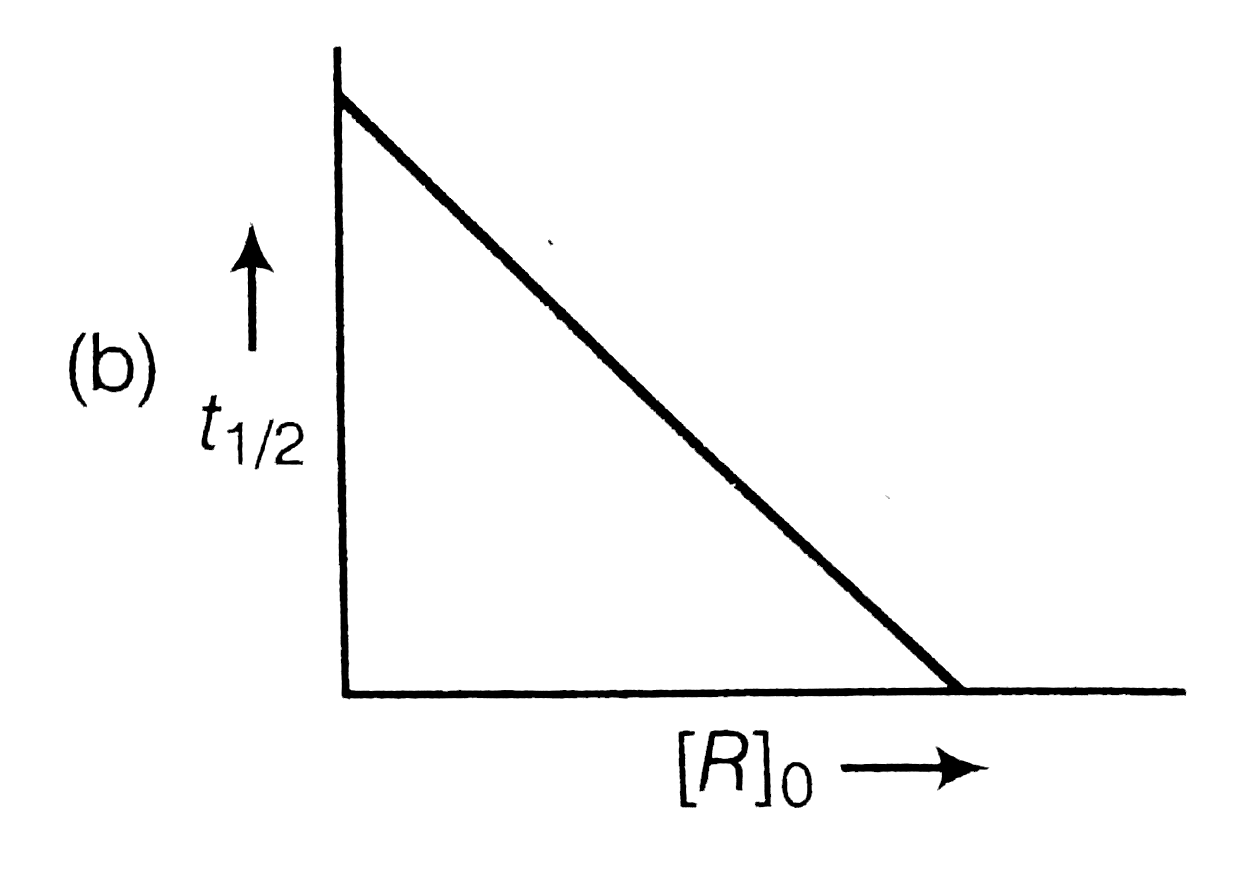
This indicates that the half-life is constant and does not depend on the initial concentration. Therefore, a graph showing half-life against concentration will be a horizontal line.
6. Conclusion:
The correct graphs for a first-order reaction are:
- A graph of log(A) vs. time (which is a straight line).
- A graph showing that half-life is constant regardless of concentration.
Final Answer:
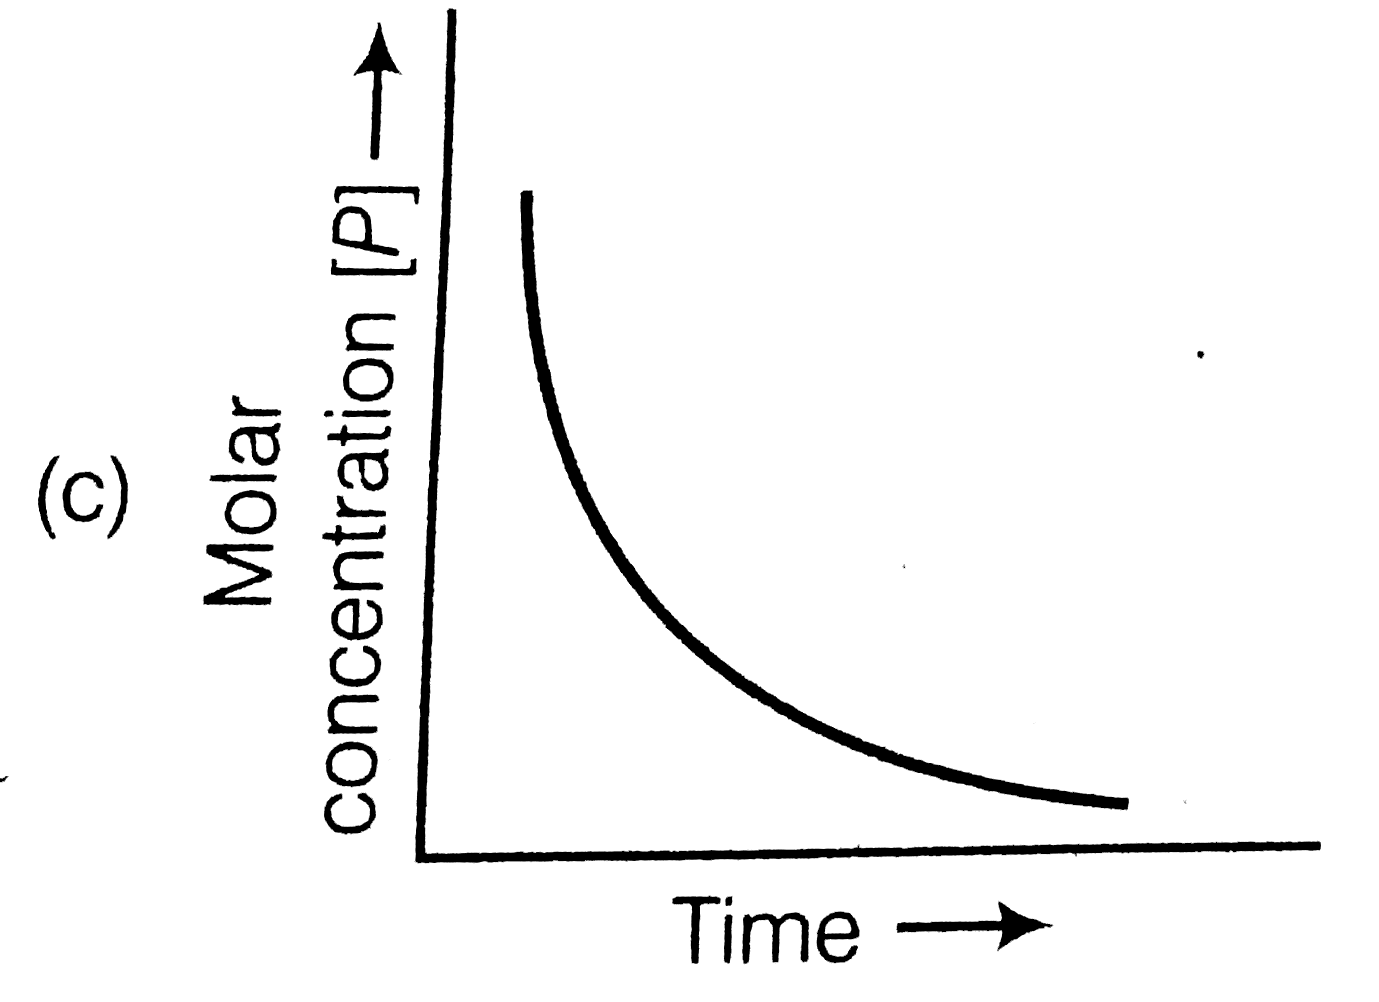
The correct options for the graphs representing a first-order reaction are Option 1 (for half-life) and Option 4 (for concentration vs. time).
The kinetic equation for a first-order reaction is given by:
k=2.303tlog((A0)(A))
where:
- k is the rate constant,
- (A0) is the initial concentration,
- (A) is the concentration at time t.
We can rearrange the equation to express it in the form of a straight line:
log(A0)−log(A)=k2.303t
This can be rewritten as:
log(A)=log(A0)−k2.303t
This is in the form y=mx+b, where:
- y=log(A),
- m=−k2.303 (the slope),
- x=t,
- b=log(A0) (the y-intercept).
The graph of a first-order reaction will be a straight line when plotting log(A) (y-axis) against time t (x-axis). The slope of this line will be negative, indicating that as time increases, the logarithm of the concentration decreases.
Based on the analysis, we are looking for a graph that shows a straight line with a negative slope when log(A) is plotted against time t.
The half-life t1/2 for a first-order reaction is given by:
t1/2=0.693k
This indicates that the half-life is constant and does not depend on the initial concentration. Therefore, a graph showing half-life against concentration will be a horizontal line.
The correct graphs for a first-order reaction are:
- A graph of log(A) vs. time (which is a straight line).
- A graph showing that half-life is constant regardless of concentration.
The correct options for the graphs representing a first-order reaction are Option 1 (for half-life) and Option 4 (for concentration vs. time).
Topper's Solved these Questions
Similar Questions
Knowledge Check
- Question 1 - Select One or More
Which of the following graph is correct for a first order reaction ?
A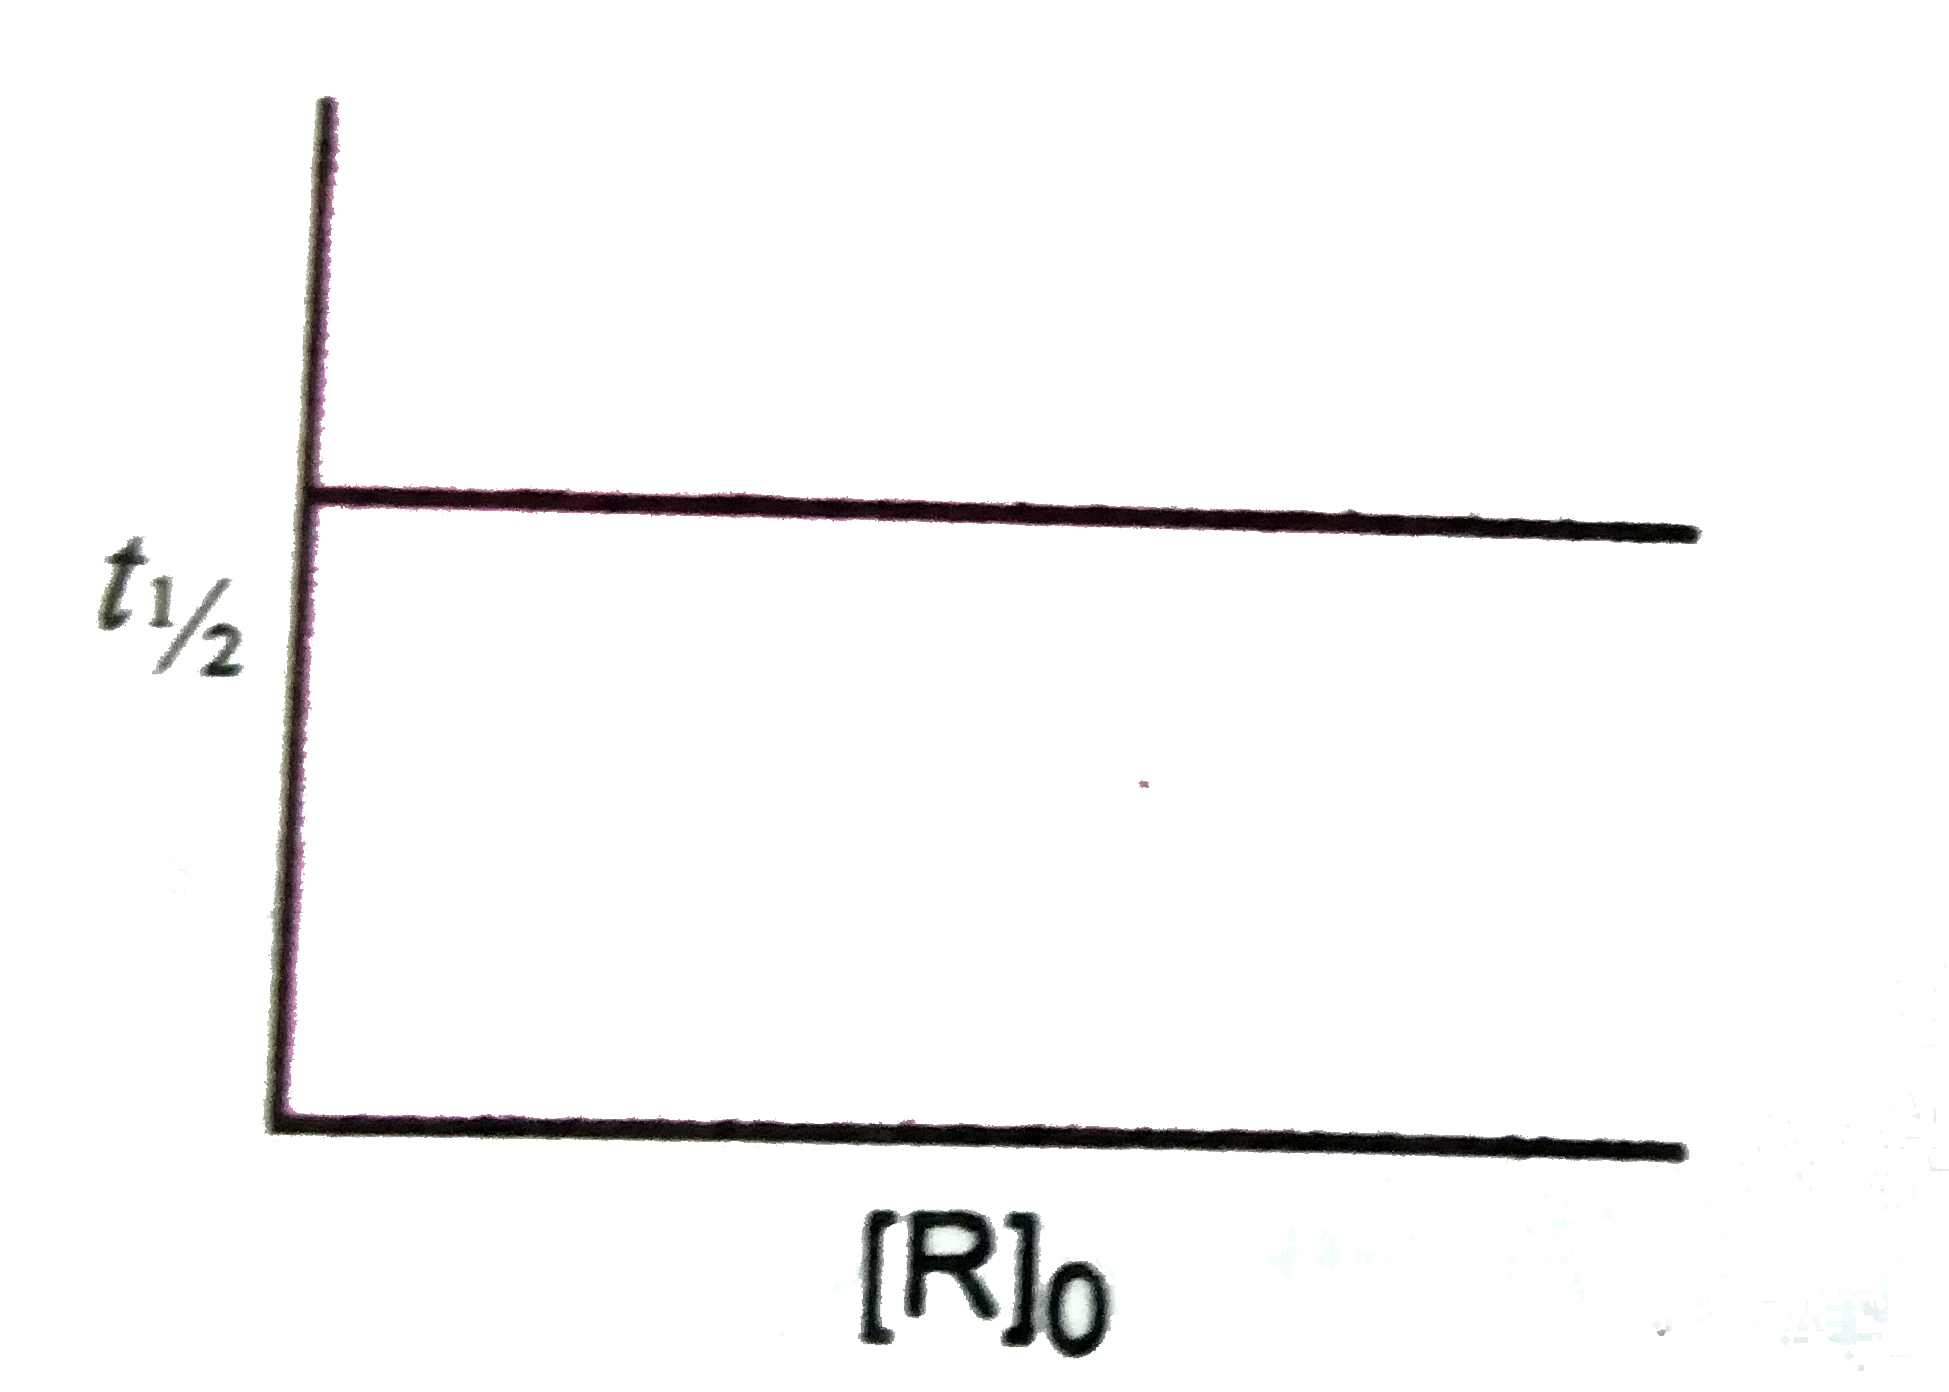 B
B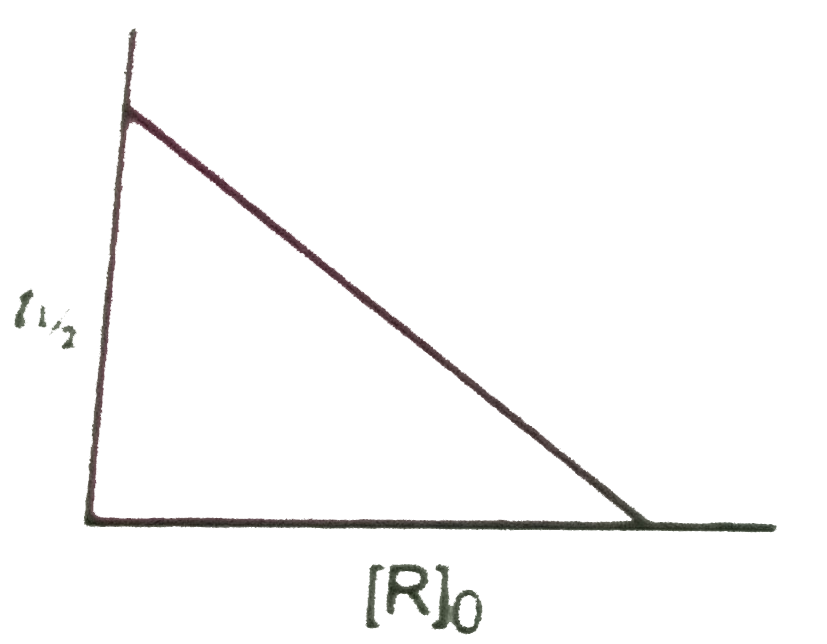 C
C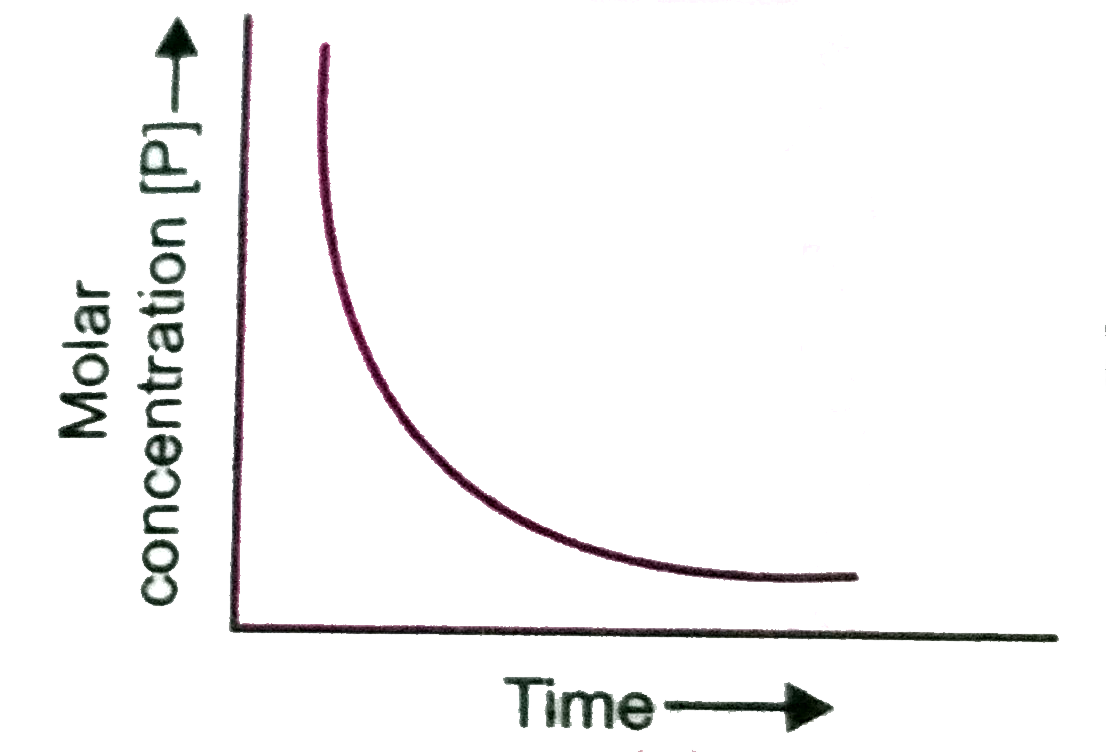 D
D
- Question 2 - Select One or More
Which of the following graphs is correct for a first order reaction?
A B
B C
C D
D
- Question 3 - Select One
Which of the following graphs is correct for a first order reaction ? (R→P)
A B
B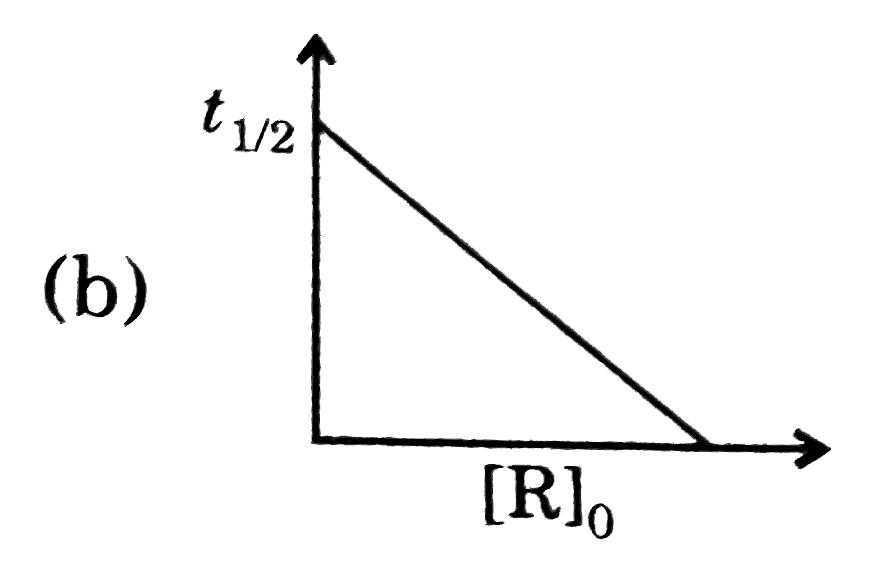 C
C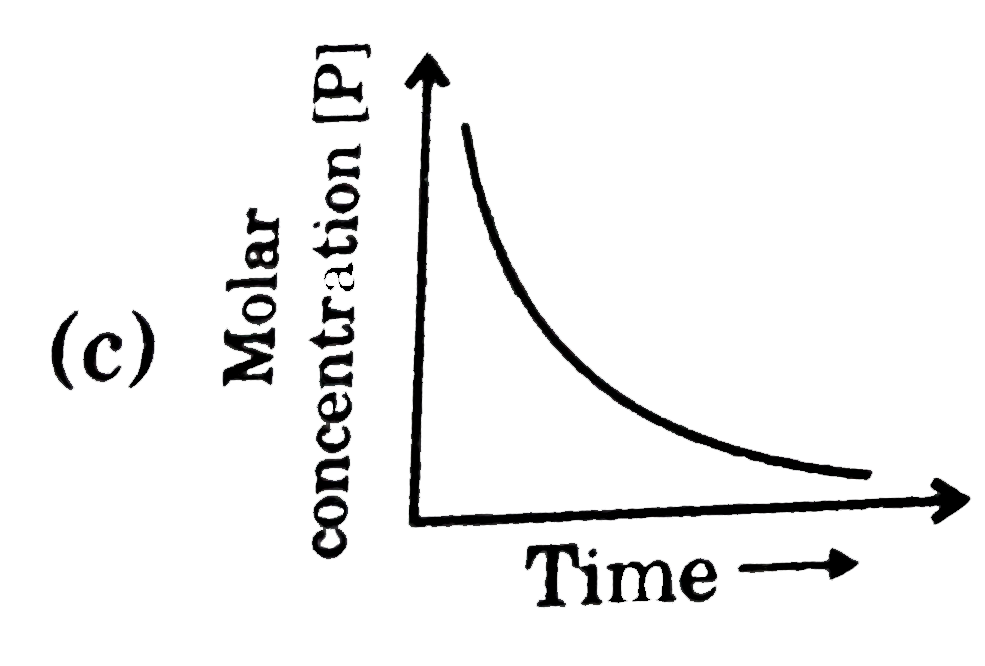 D
D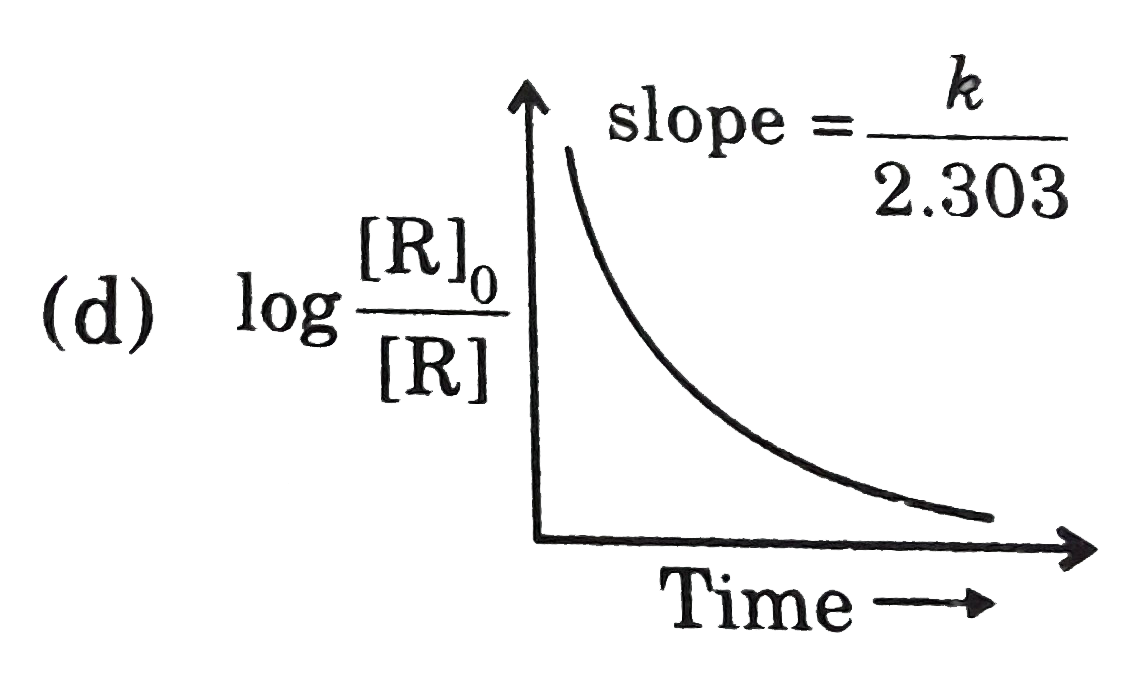
Which of the following relation is correct for a first order reaction?
(K=rate constant, r=rate of reaction, c = cone, of reactant)View SolutionWhich of the following graphs is correct for second order reaction ?
View SolutionWhich of the following is (are) not correct for a first order reaction?
View SolutionWhich of the following graph is correct for zero order reaction?
View Solution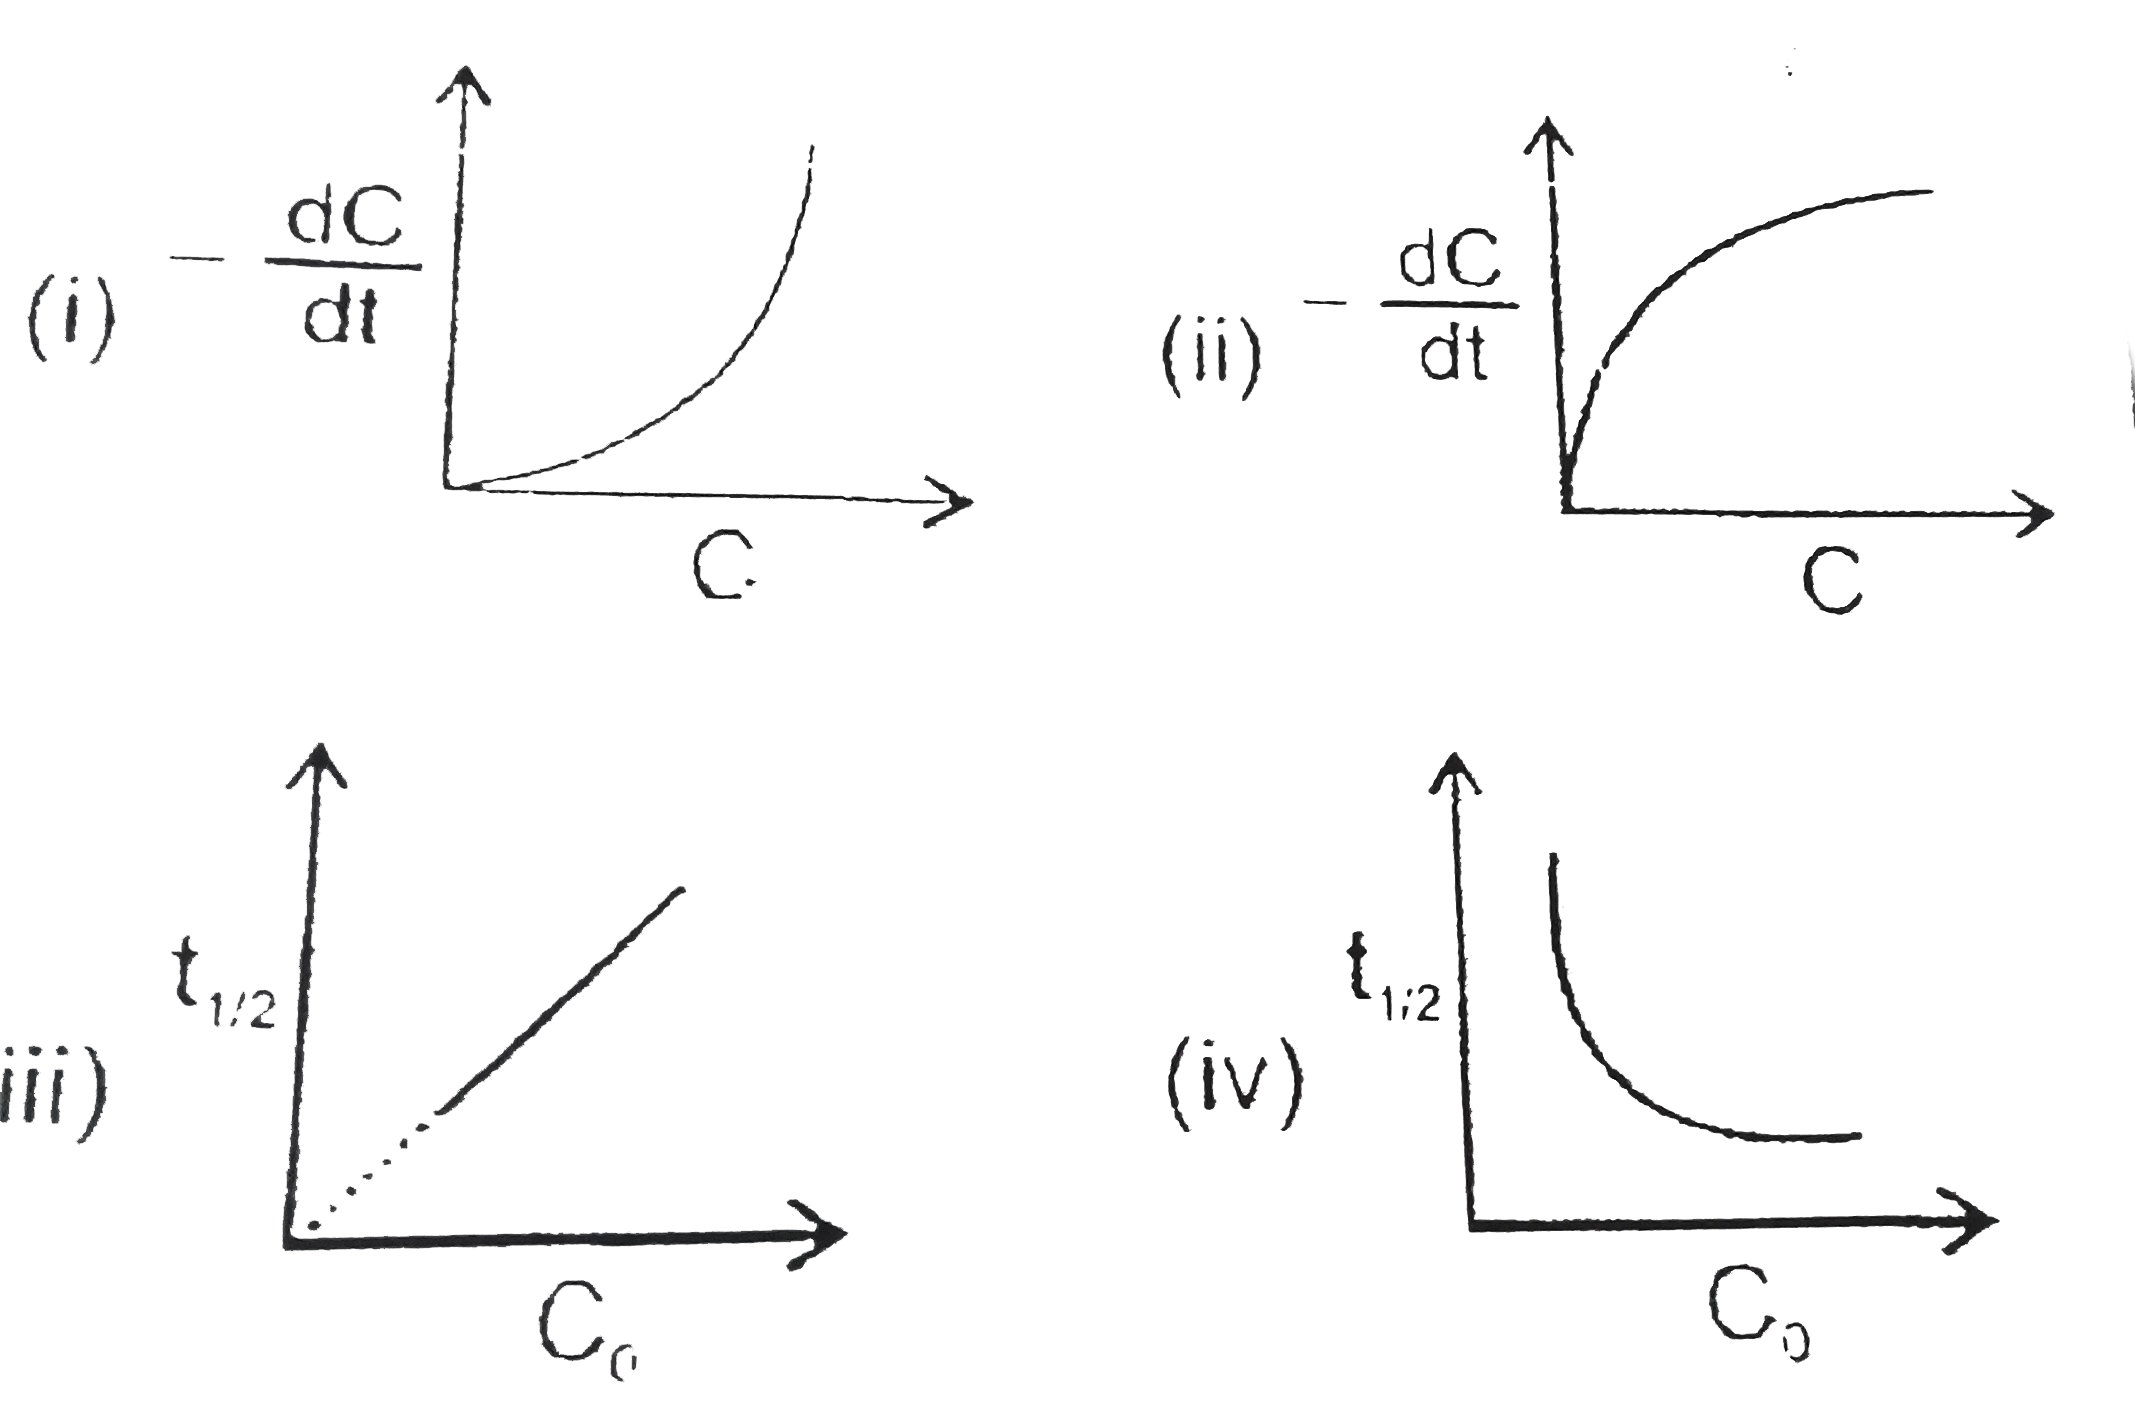
Which of the following graphs are correct for a second order reaction: (where symbols have their usual meanings)View Solution
