Within elastic limit, which of the following graphs correctly represents the variation of extension in the length of wire with the external load?
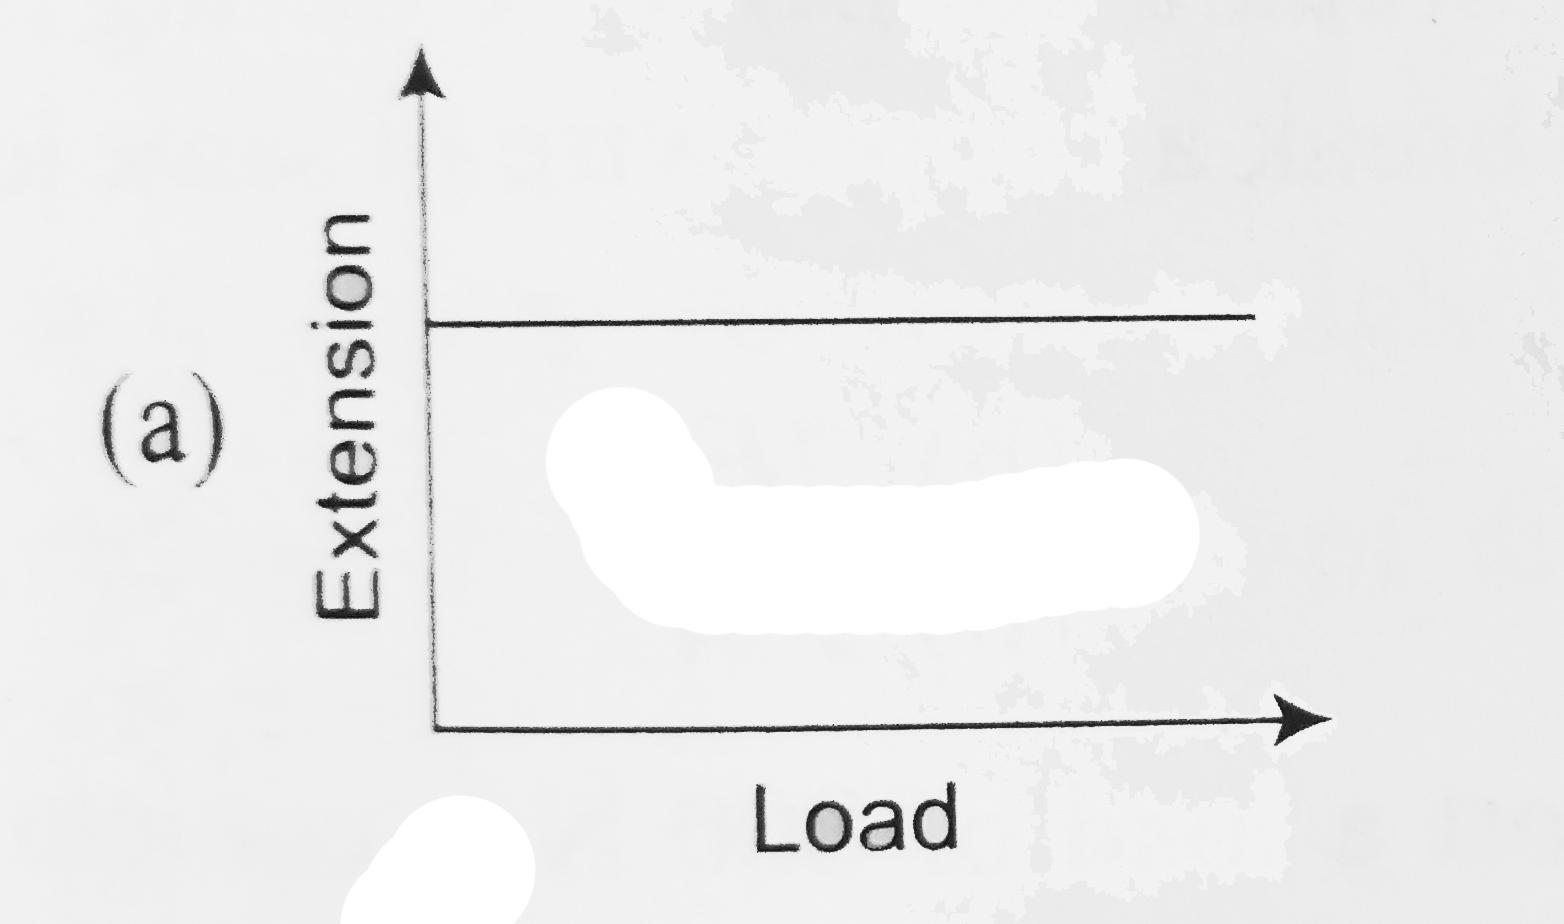
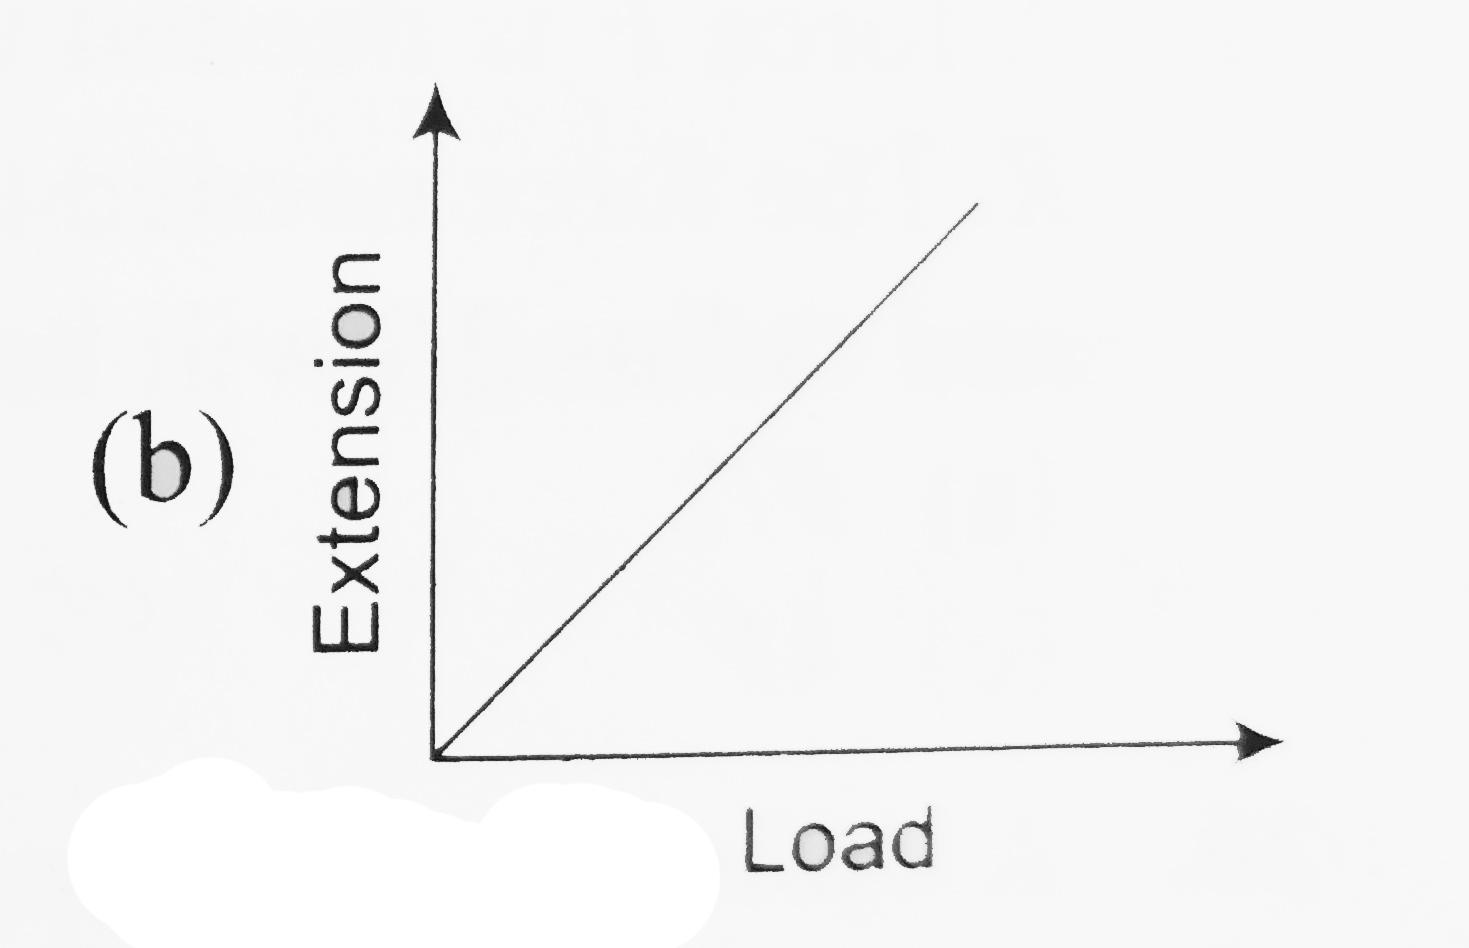
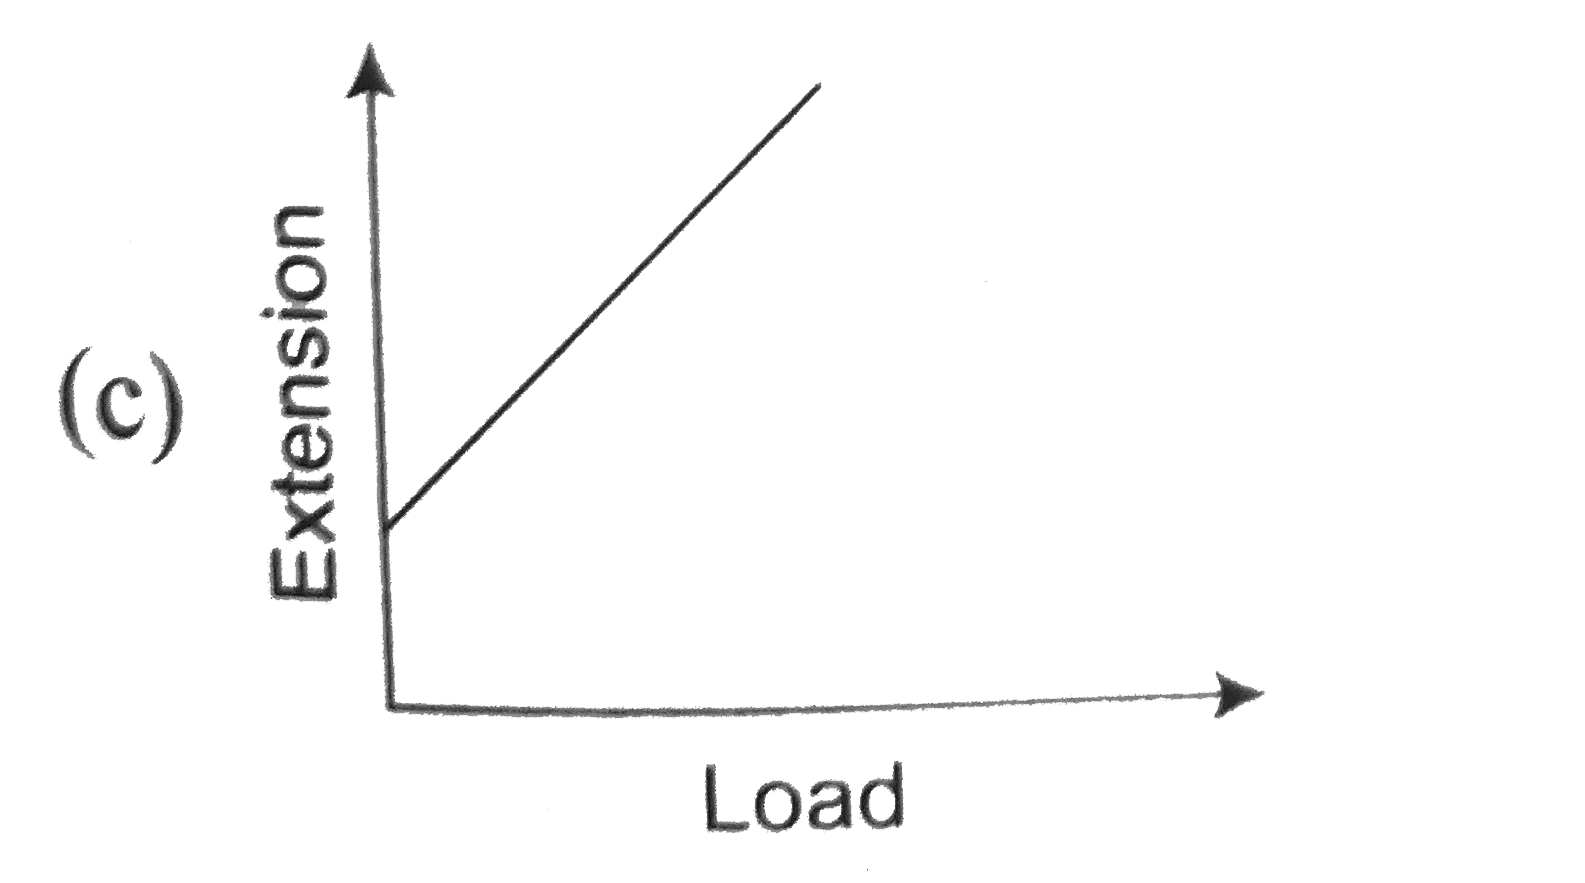
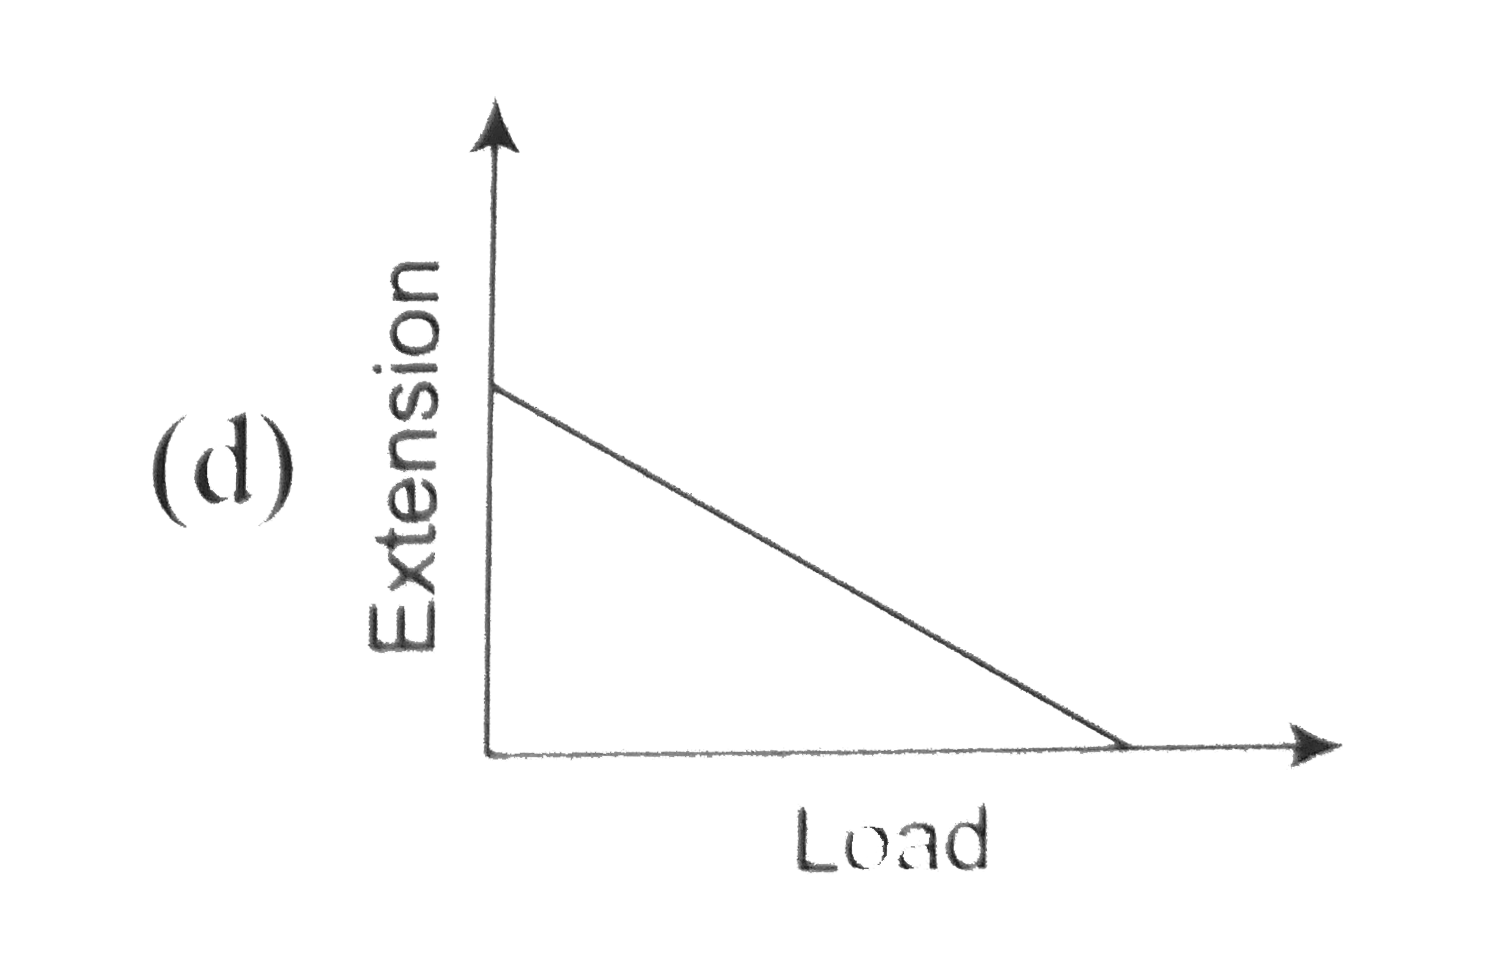
The correct Answer is:B
To solve the question regarding the variation of extension in the length of a wire with the external load within the elastic limit, we can follow these steps:
1. Understand Hooke's Law:
Hooke's Law states that the extension (x) of an elastic material is directly proportional to the load (F) applied to it, as long as the material is within its elastic limit. This can be mathematically expressed as:
F=kx
where F is the load, k is the spring constant (a measure of stiffness), and x is the extension.
2. Identify the Relationship:
From Hooke's Law, we can see that if we plot the load (F) on the y-axis and the extension (x) on the x-axis, the relationship will be linear. This means that as the load increases, the extension increases proportionally.
3. Graph Characteristics:
- The graph will be a straight line starting from the origin (0,0) because when there is no load, there is no extension.
- The slope of the line will be equal to the spring constant k.
4. Select the Correct Graph:
Based on the understanding that the relationship is linear within the elastic limit, we need to look for a graph that shows a straight line starting from the origin.
5. Conclusion:
The correct graph that represents the variation of extension in the length of the wire with the external load within the elastic limit is the one that is a straight line through the origin.
Final Answer:
The correct option is (b), which shows a linear relationship between load and extension.
---
Hooke's Law states that the extension (x) of an elastic material is directly proportional to the load (F) applied to it, as long as the material is within its elastic limit. This can be mathematically expressed as:
F=kx
where F is the load, k is the spring constant (a measure of stiffness), and x is the extension.
From Hooke's Law, we can see that if we plot the load (F) on the y-axis and the extension (x) on the x-axis, the relationship will be linear. This means that as the load increases, the extension increases proportionally.
- The graph will be a straight line starting from the origin (0,0) because when there is no load, there is no extension.
- The slope of the line will be equal to the spring constant k.
Based on the understanding that the relationship is linear within the elastic limit, we need to look for a graph that shows a straight line starting from the origin.
The correct graph that represents the variation of extension in the length of the wire with the external load within the elastic limit is the one that is a straight line through the origin.
The correct option is (b), which shows a linear relationship between load and extension.
Topper's Solved these Questions
- BOOK - A2ZCHAPTER - PROPERTIES OF MATTEREXERCISE - Bulk Modulus And Shear Modulus29videos
PROPERTIES OF MATTER
- BOOK - A2ZCHAPTER - PROPERTIES OF MATTEREXERCISE - Elasticity And Work Done In Stretching A Wire25videos
PROPERTIES OF MATTER
- BOOK - A2ZCHAPTER - OSCILLATION AND SIMPLE HARMONIC MOTIONEXERCISE - Chapter Test29videos
OSCILLATION AND SIMPLE HARMONIC MOTION
- BOOK - A2ZCHAPTER - ROTATIONAL DYNAMICSEXERCISE - Chapter Test29videos
ROTATIONAL DYNAMICS
Similar Questions
Knowledge Check
- Question 1 - Select One
Which of the following graph is correctly represented?
A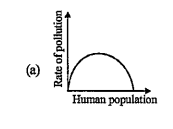 B
B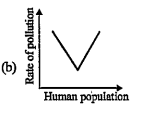 C
C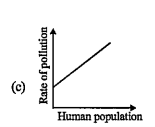 D
D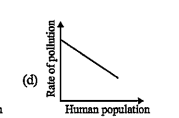
- Question 2 - Select One
Which of the following graphs best represents the variation of acceleration 'a' with displacement x?
A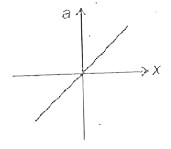 B
B C
C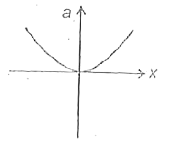 D
D
- Question 3 - Select One
Which of the following graphs represents freundlich adsorption isotherm?
A B
B C
C D
D
Which of the following graphs correctly represents the variation of particle momentum with associated de Broglie wavelength?
View SolutionWhich of the following graphs correctly represents the variation of β=−(dV/dP)/V with P for an ideal gas at constant temperature?
View SolutionWhich of the following graphs correctly represents the variation of β=−dV/dPV
with P for an ideal gas at constant temperature?View SolutionWhich of the following graphs represents the variation of activity (A) of a radioactive substance with time (t).
View SolutionWhich of the following graph correctly represents the variation of molar conductance (Δm) with dilution for a strong electrolyte ?
View Solution

