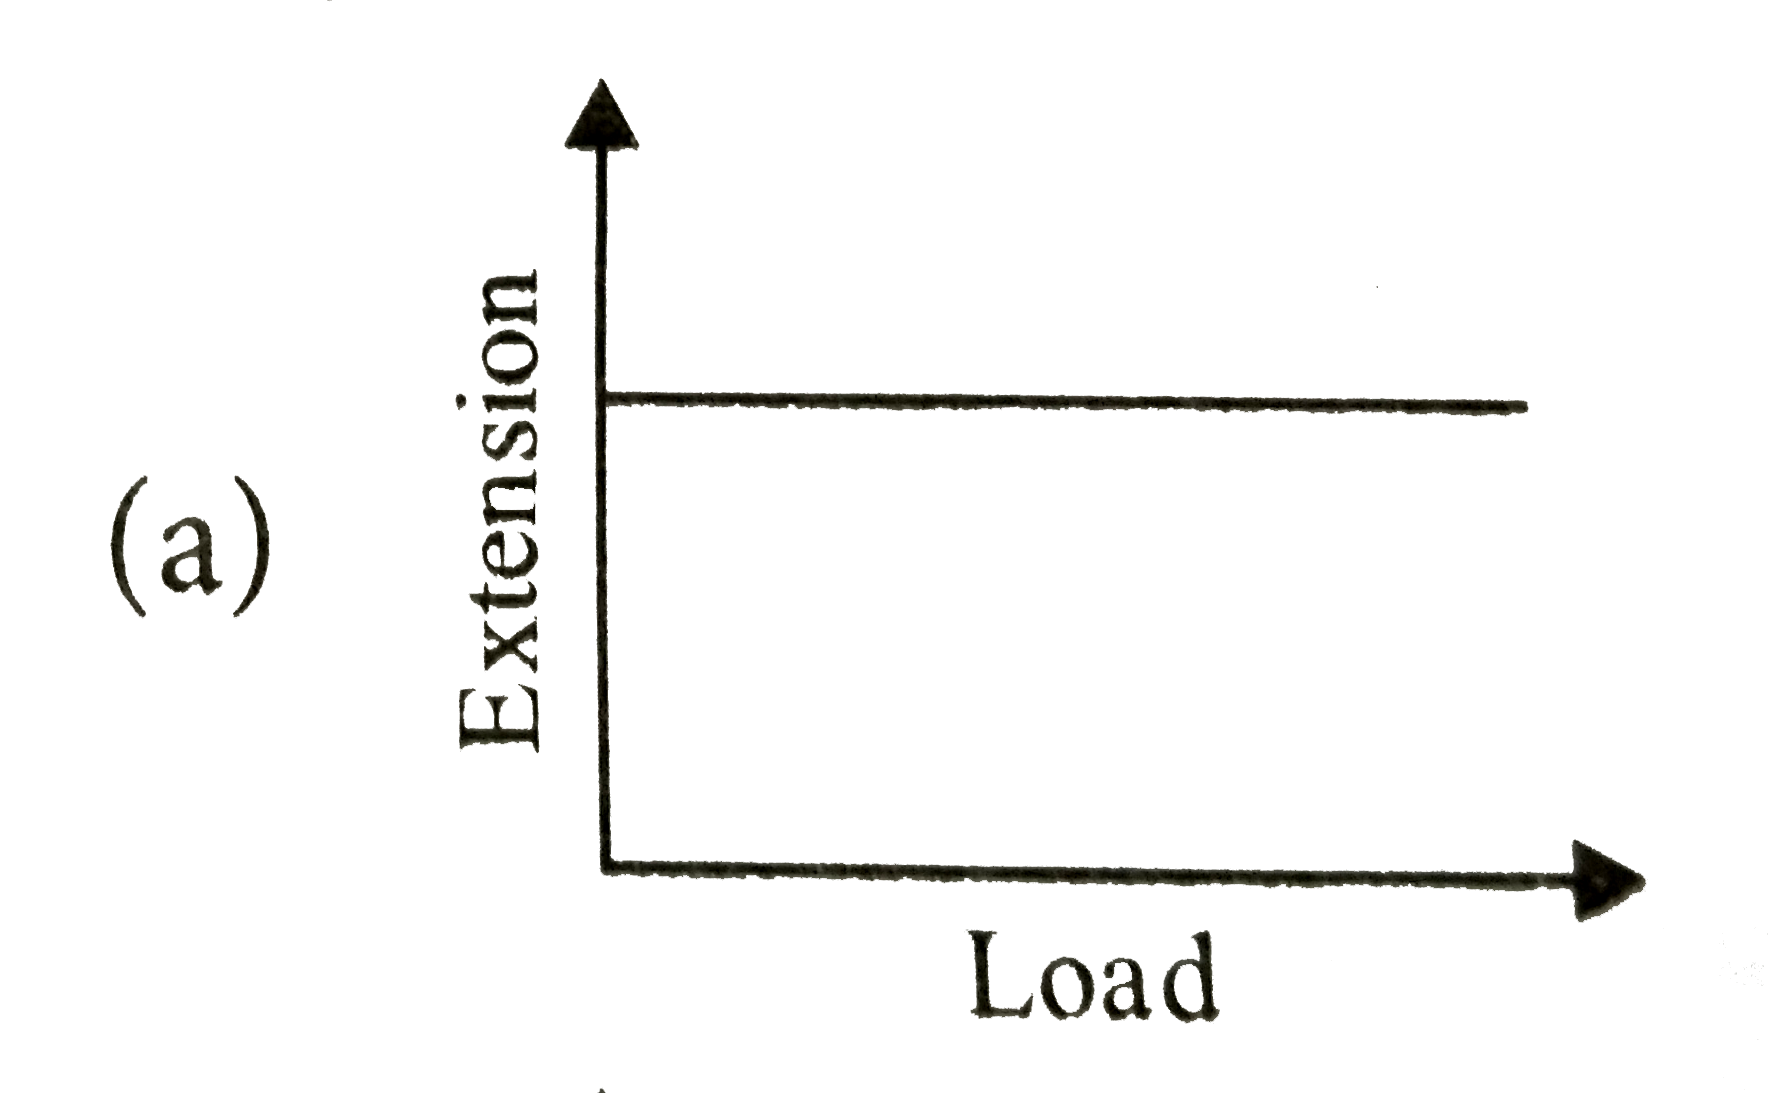
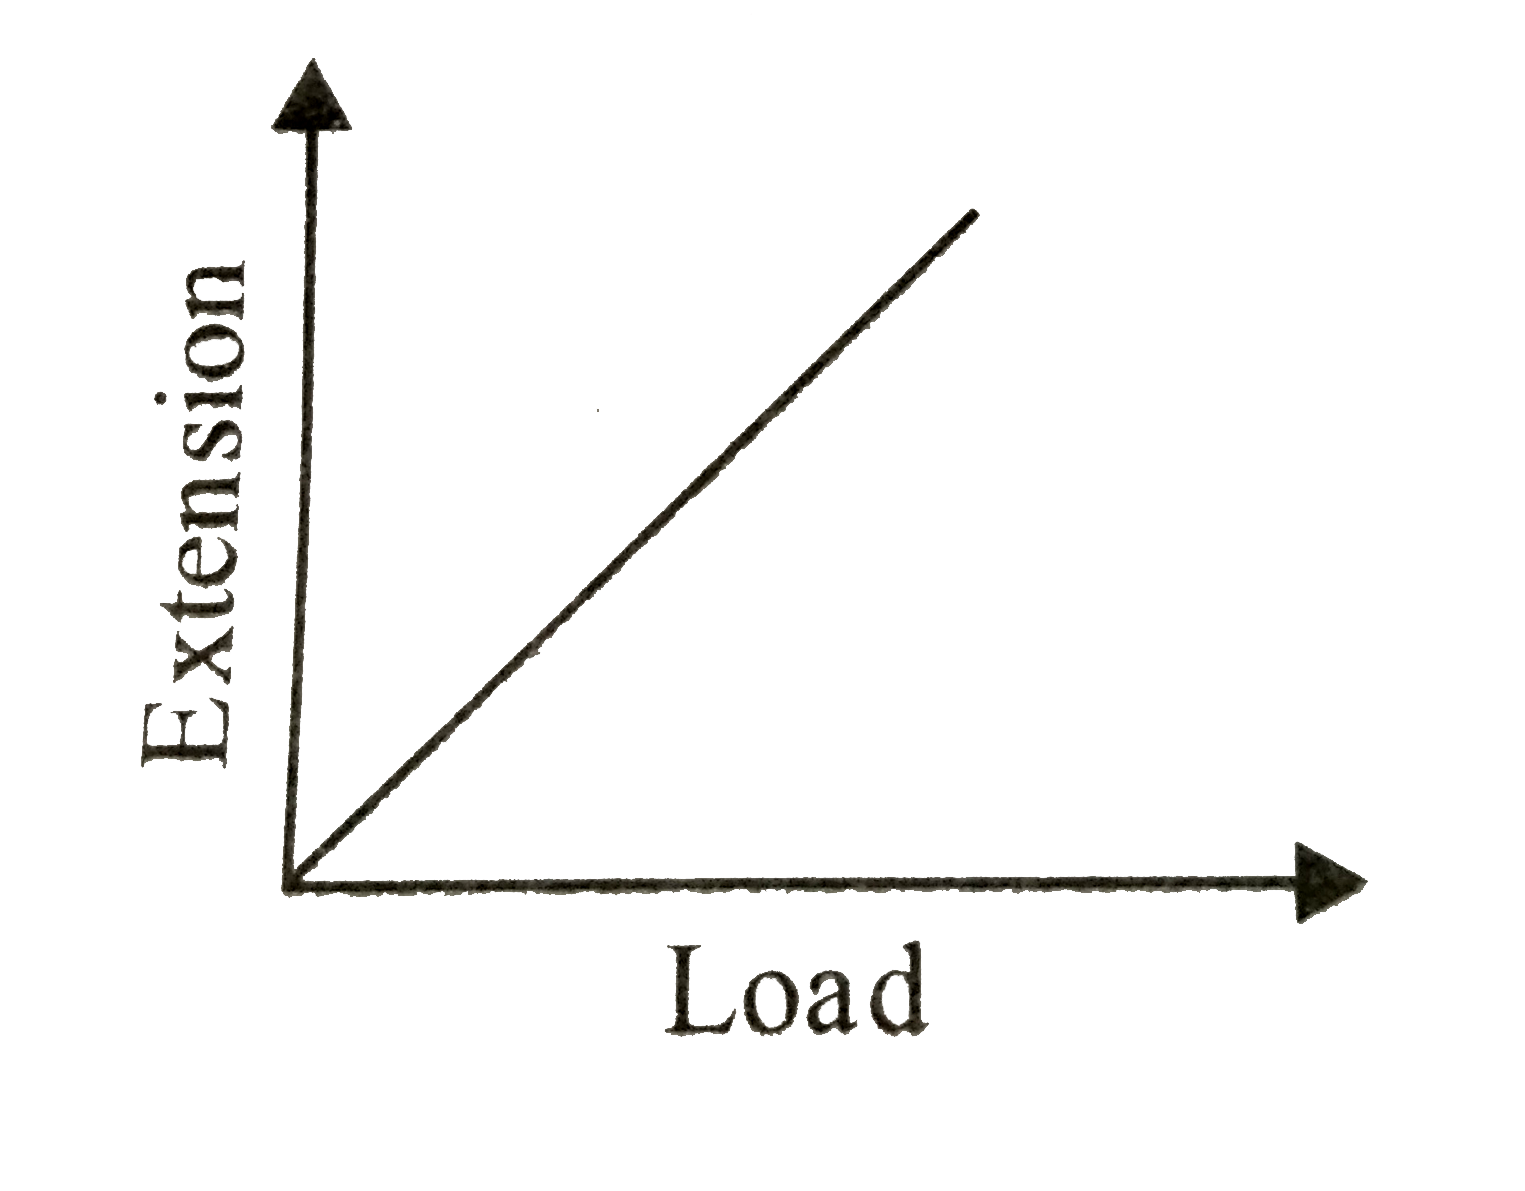
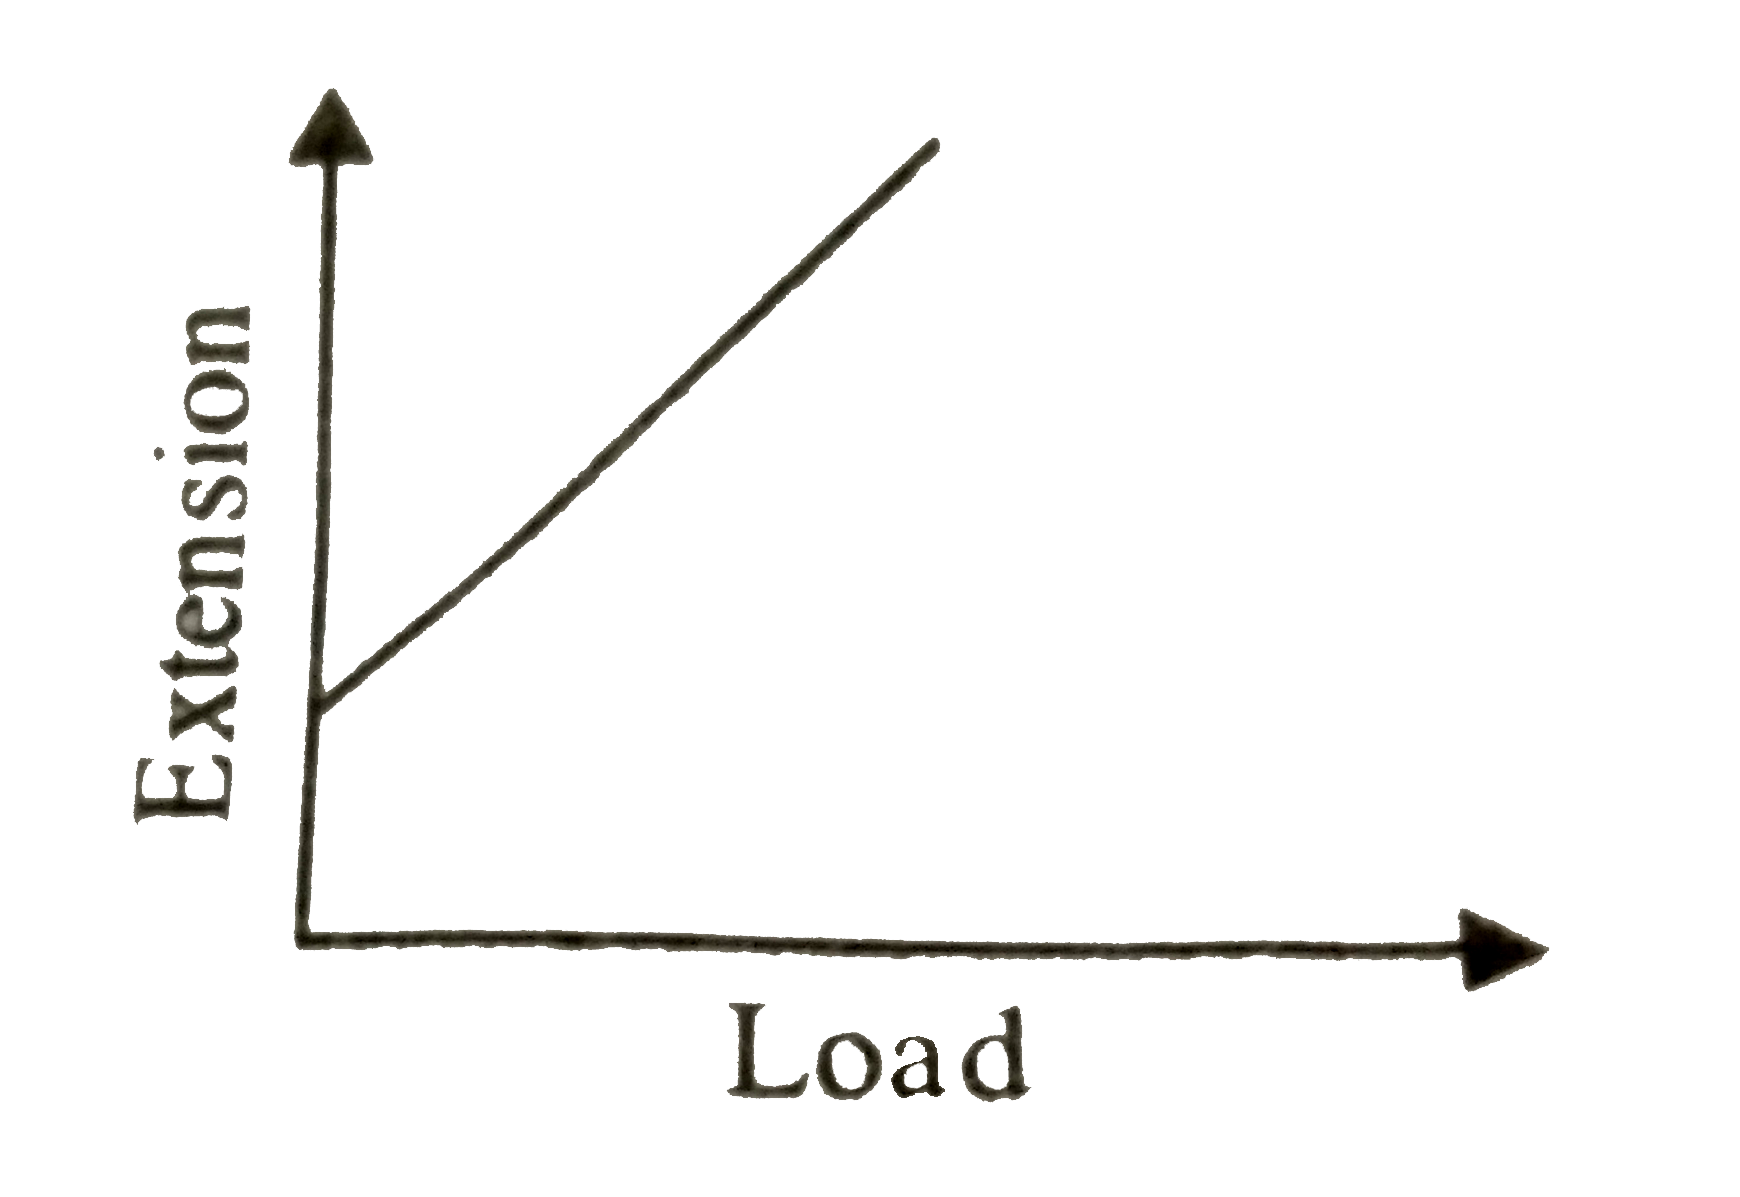
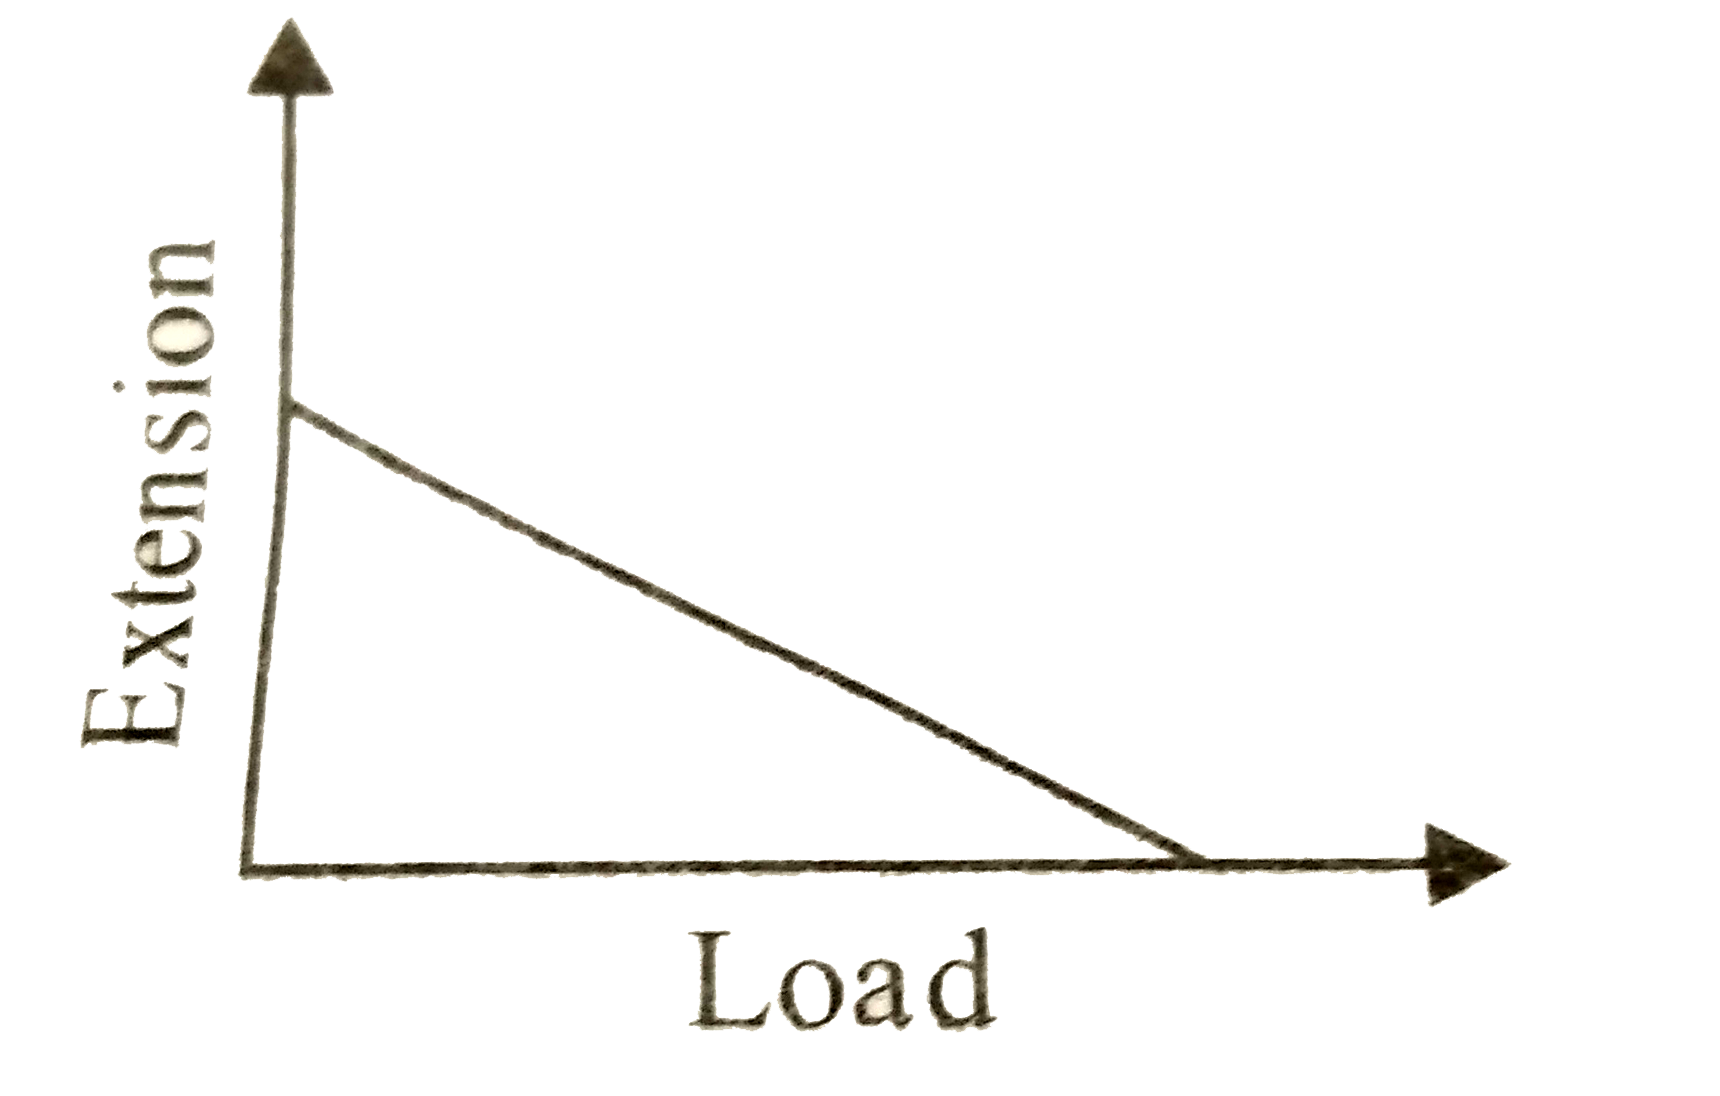
Within elastic limit, which of the following graphs correctly represents the variation of extension in the length of wire with the external load?
A
B
C
D
Video Solution
Text Solution
The correct Answer is:B
According to Hooke's law, Within elastic limit, Extension ∝ Load applied Hence, option (b) represents the correct graph.
|
Topper's Solved these Questions
- MECHANICAL PROPERTIES OF SOLIDSBOOK - NCERT FINGERTIPSCHAPTER - MECHANICAL PROPERTIES OF SOLIDSEXERCISE - Stress-Strain Curve
5 Videos
- MECHANICAL PROPERTIES OF SOLIDSBOOK - NCERT FINGERTIPSCHAPTER - MECHANICAL PROPERTIES OF SOLIDSEXERCISE - Elastic Moduli
69 Videos
- MECHANICAL PROPERTIES OF SOLIDSBOOK - NCERT FINGERTIPSCHAPTER - MECHANICAL PROPERTIES OF SOLIDSEXERCISE - Stress And Strain
9 Videos
- MECHANICAL PROPERTIES OF FLUIDSBOOK - NCERT FINGERTIPSCHAPTER - MECHANICAL PROPERTIES OF FLUIDSEXERCISE - Assertion And Reason
15 Videos
- MOTION IN A PLANE BOOK - NCERT FINGERTIPSCHAPTER - MOTION IN A PLANE EXERCISE - Assertion And Reason
15 Videos
Similar Questions
Knowledge Check
Which of the following graph is correctly represented?
A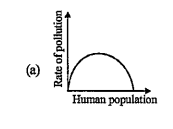 B
B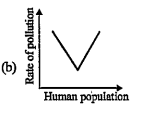 C
C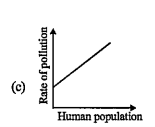 D
D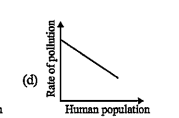
Which of the following graphs best represents the variation of acceleration 'a' with displacement x?
A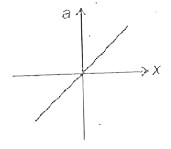 B
B C
C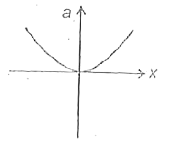 D
D
Which of the following graphs represents freundlich adsorption isotherm?
A B
B C
C D
D
Which of the following graphs correctly represents the variation of particle momentum with associated de Broglie wavelength?
View SolutionWhich of the following graphs correctly represents the variation of β=−(dV/dP)/V with P for an ideal gas at constant temperature?
View SolutionWhich of the following graphs correctly represents the variation of β=−dV/dPV
with P for an ideal gas at constant temperature?
View SolutionWhich of the following graphs represents the variation of activity (A) of a radioactive substance with time (t).
View SolutionWhich of the following graph correctly represents the variation of molar conductance (Δm) with dilution for a strong electrolyte ?
View Solution

