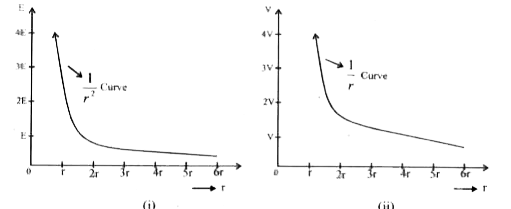
You are given two graphs. What conclusion do you draw from the graphs?
 Solution in Tamil
The first figure shows the variation of field intensity of a point charge and the second figure shows the potential of a point charge.
Topper's Solved these Questions
- ELECTROSTATIC POTENTIAL AND CAPACITANCEBOOK - NEW JOYTHI PUBLICATIONCHAPTER - ELECTROSTATIC POTENTIAL AND CAPACITANCEEXERCISE - Previous Year Questions
2 Videos
- ELECTROSTATIC POTENTIAL AND CAPACITANCEBOOK - NEW JOYTHI PUBLICATIONCHAPTER - ELECTROSTATIC POTENTIAL AND CAPACITANCEEXERCISE - Competitive Exam Corner
22 Videos
- ELECTROSTATIC POTENTIAL AND CAPACITANCEBOOK - NEW JOYTHI PUBLICATIONCHAPTER - ELECTROSTATIC POTENTIAL AND CAPACITANCEEXERCISE - Practice Problems For Self Assessment
23 Videos
- ELECTROMAGNETIC WAVES BOOK - NEW JOYTHI PUBLICATIONCHAPTER - ELECTROMAGNETIC WAVES EXERCISE - COMPETITIVE EXAM CORNER
16 Videos
- MAGNETISM AND MATTERBOOK - NEW JOYTHI PUBLICATIONCHAPTER - MAGNETISM AND MATTEREXERCISE - COMPETITIVE EXAM CORNER
13 Videos
Similar Questions
A. A device to store electrical charge is called
a. Transformer
b. Capacitor
c. Resistor d. Inductor
B. What is meant by energy density of a parallel plate capacitor?
C. Derive an expression for the energy stored in a parallel plate capacitor.
D. What is the area of the plates of a 0.1μF parallel plate air capacitor, given that the separation between the plates is 0.1 mm.
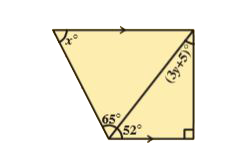
View SolutionFrom the figure find x and y.
View SolutionCalculating the work done in eV in carrying a charge +e Coulomb through a potential rise of 100 volts. (1.0eV=1.6×10⁻¹⁹joules)
View SolutionIf the total electromagnetic energy falling on a surface is U, then the total momentum delivered (for complete absorption) is
View SolutionChoose the correct statement .
View SolutionWhat conclusion do you draw when displacement-time graph of a body is as shwon in Figure ?
View SolutionDraw velocity-time graph of a unitorm motion of an object along a straight line. What do you study from this graph ?
View SolutionA graph plotted between log t50% vs log concentration is a straight line. What conclusion can you draw from this graph?
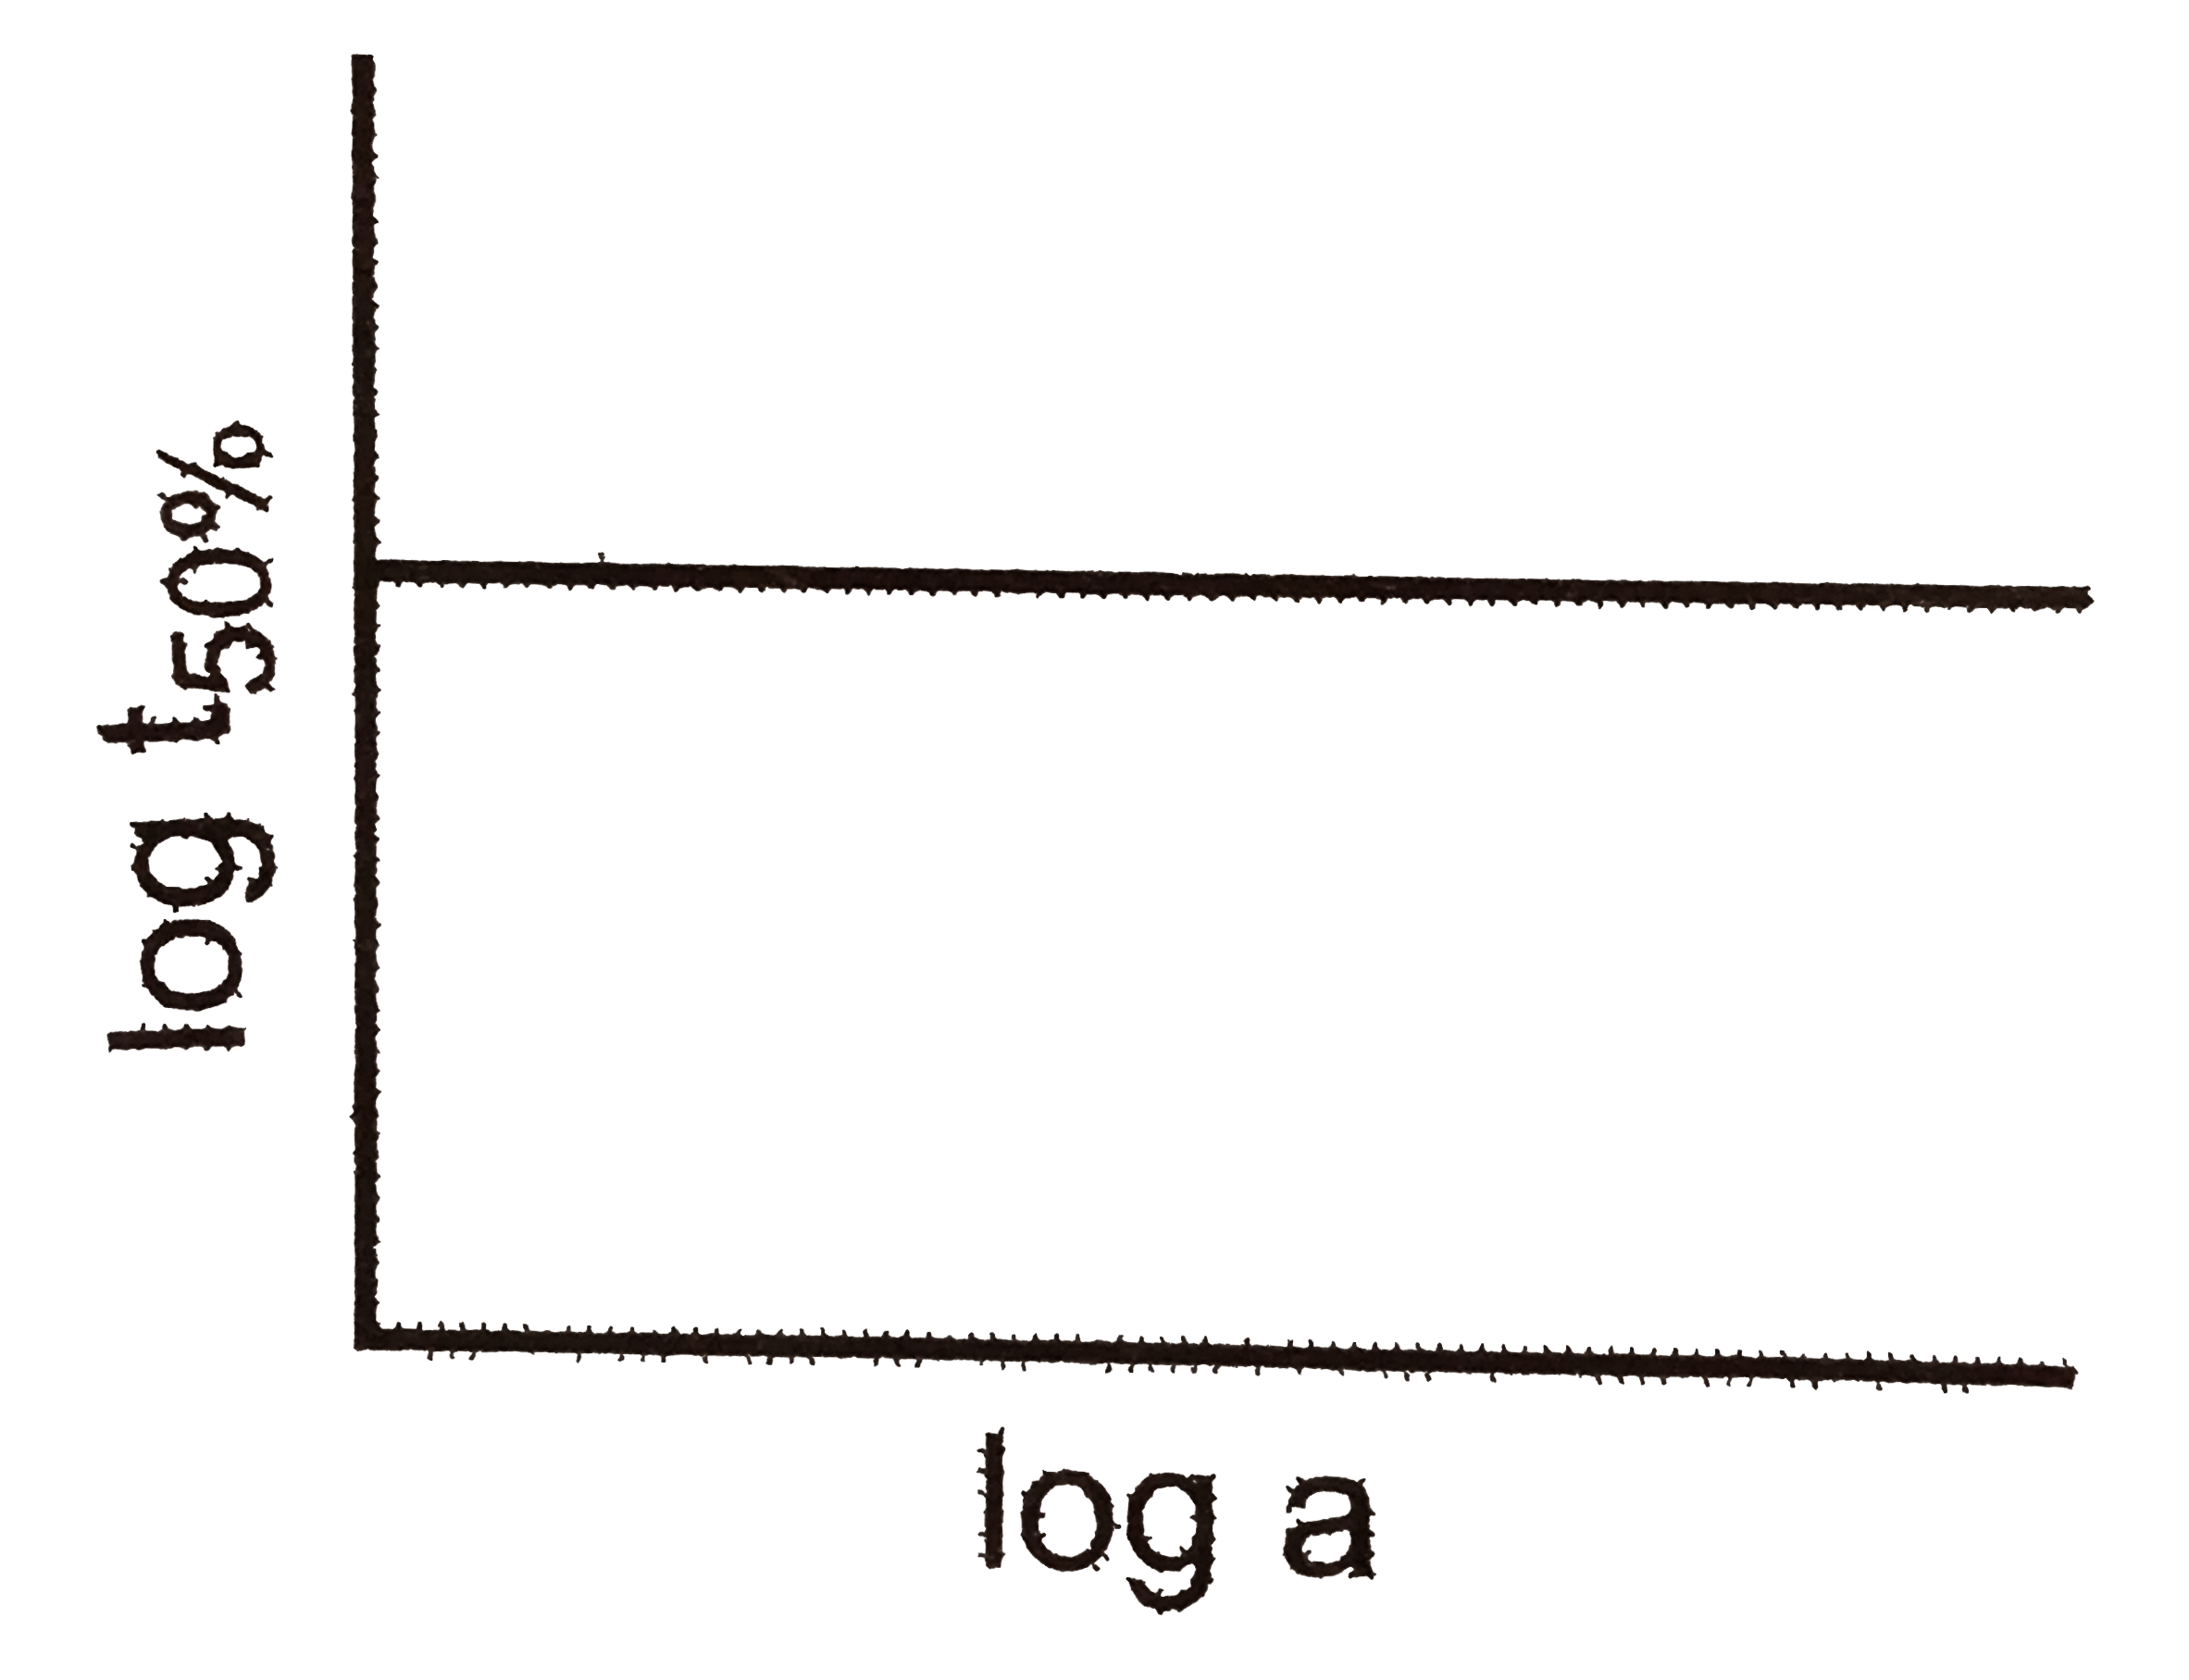
View SolutionA graph plotted between log t50% vs log concentration is a straight line. What conclusion can you draw from this graph?

View SolutionWhat conclusion would you draw from the following graphs for an ideal gas?
View SolutionA graph plotted between log t_(50%) vs log concentration in a straight line. What conclusion can you draw from this graph?
View SolutionWhat conclusion can you draw about the velocity of a body from the displacement-time graph shown below :
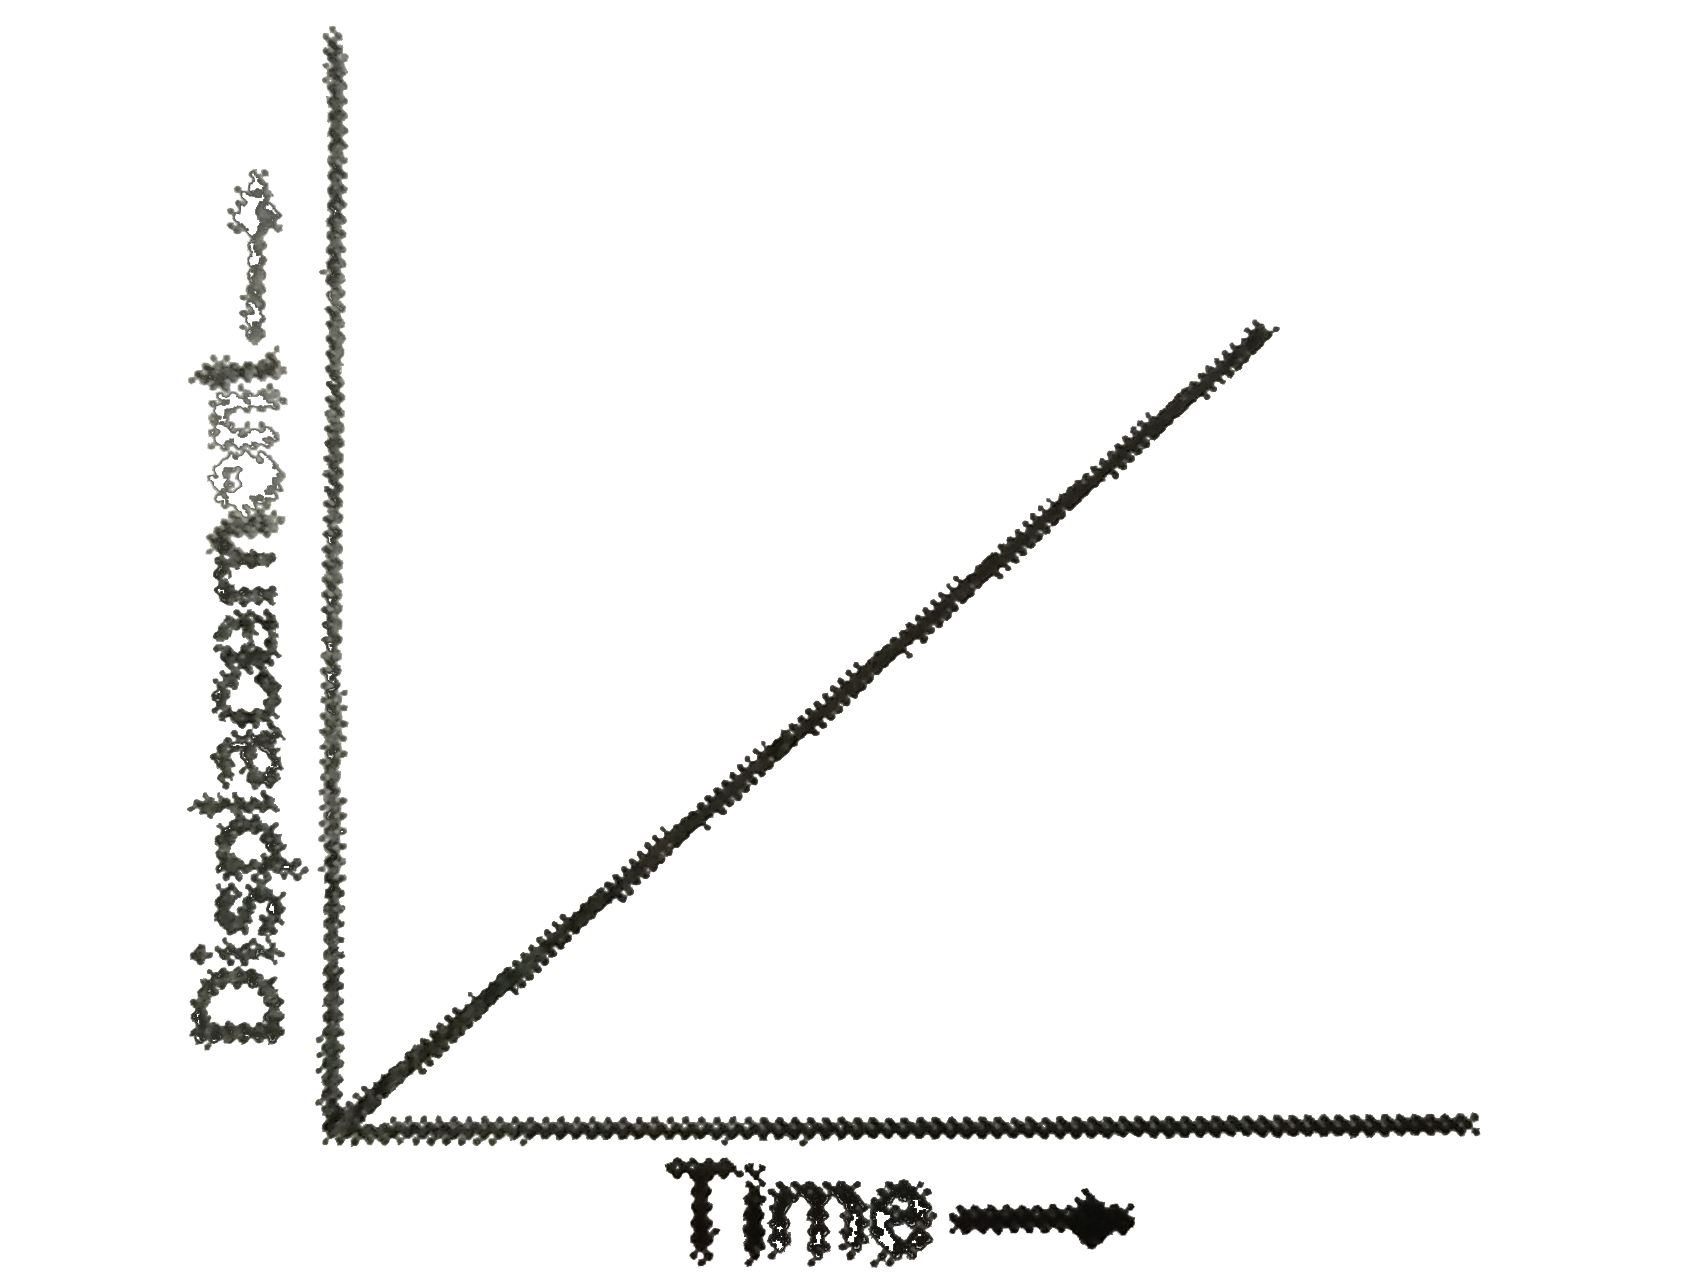
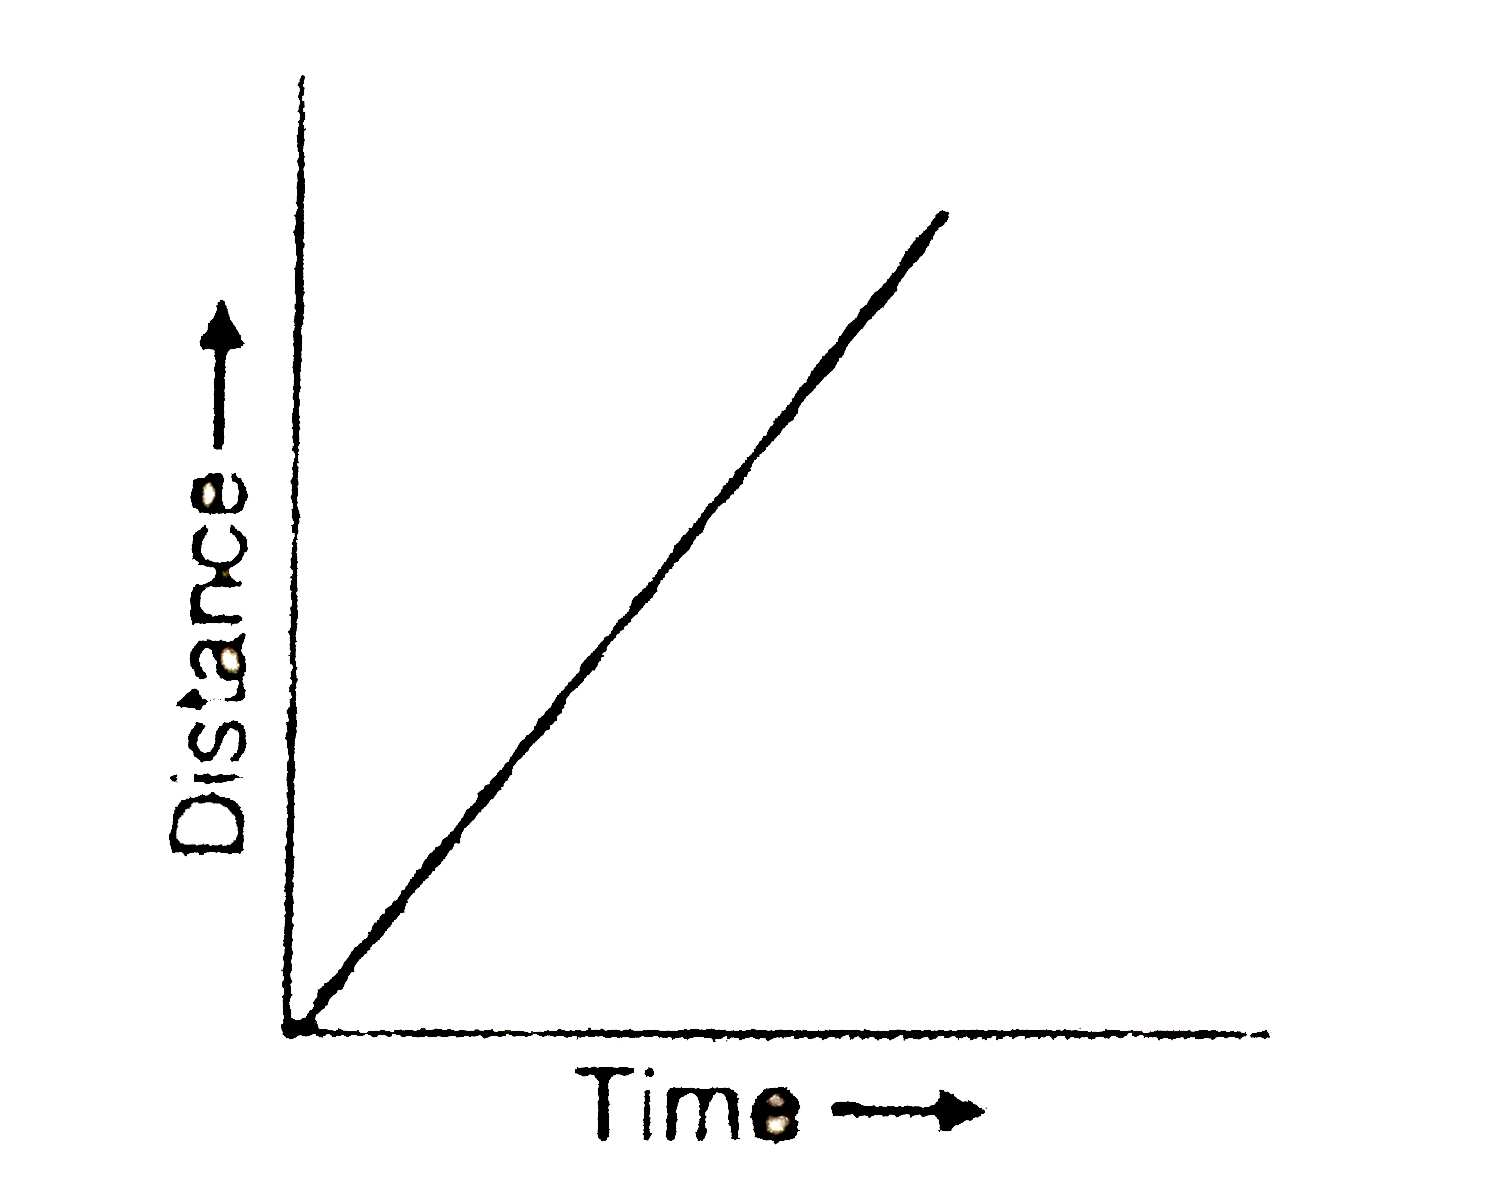
View SolutionWhat conclusion can you draw about the speed of a body from the following distance-time graph ?
View SolutionWhat conclusion can you draw about the acceleration of a body from the speed-time graph shown below ?
View Solutionनाभिक की बंधन ऊर्जा से आप क्या समझते हैं? नाभिकों की प्रति न्यूक्लिऑन बंधन ऊर्जा तथा द्रव्यमान संख्या की बीच ग्राफ खींचिए। इस ग्राफ को क्या कहते हैं इस ग्राफ से प्राप्त महत्वपूर्ण निष्कर्षों को लिखिए।
View Solution
