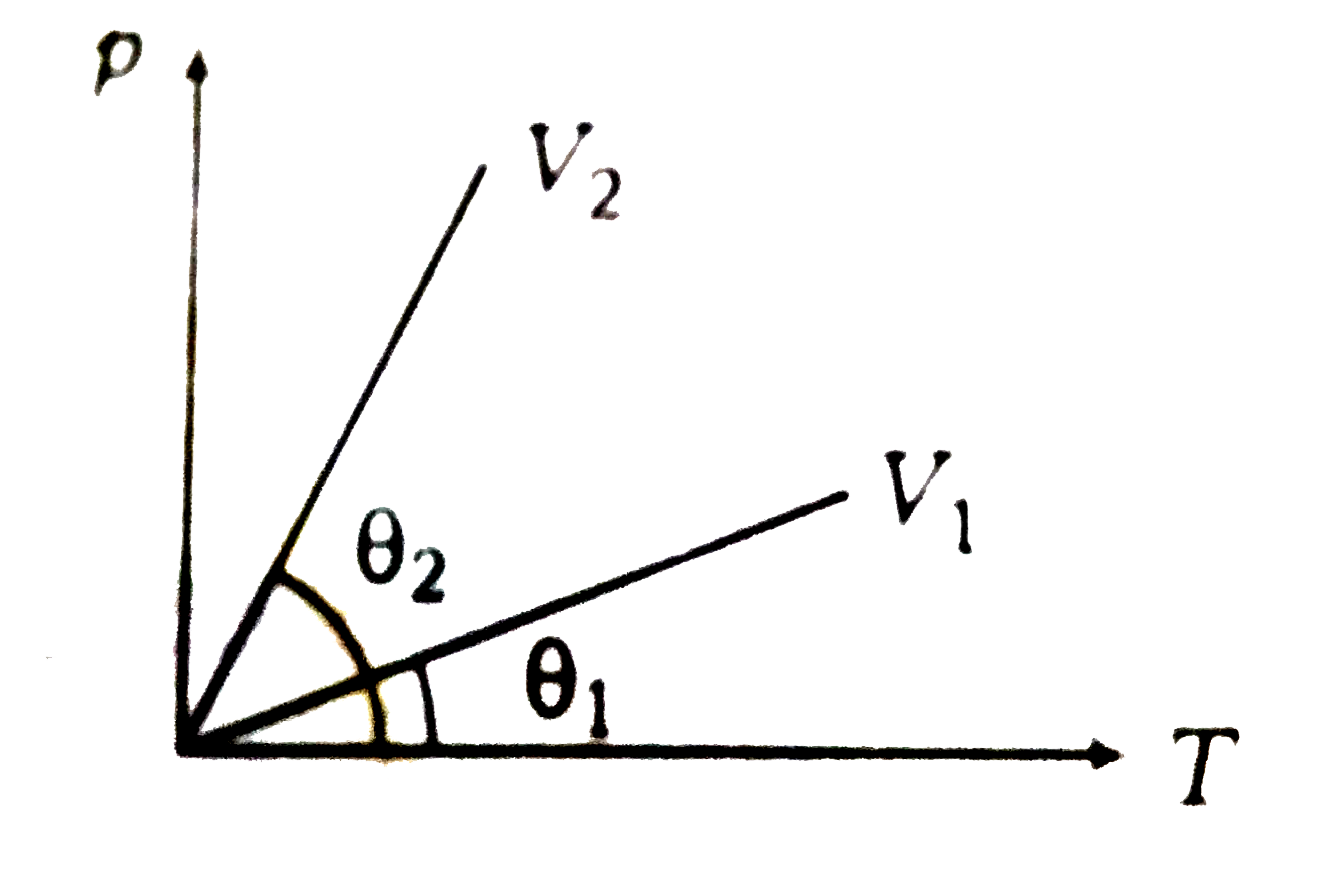
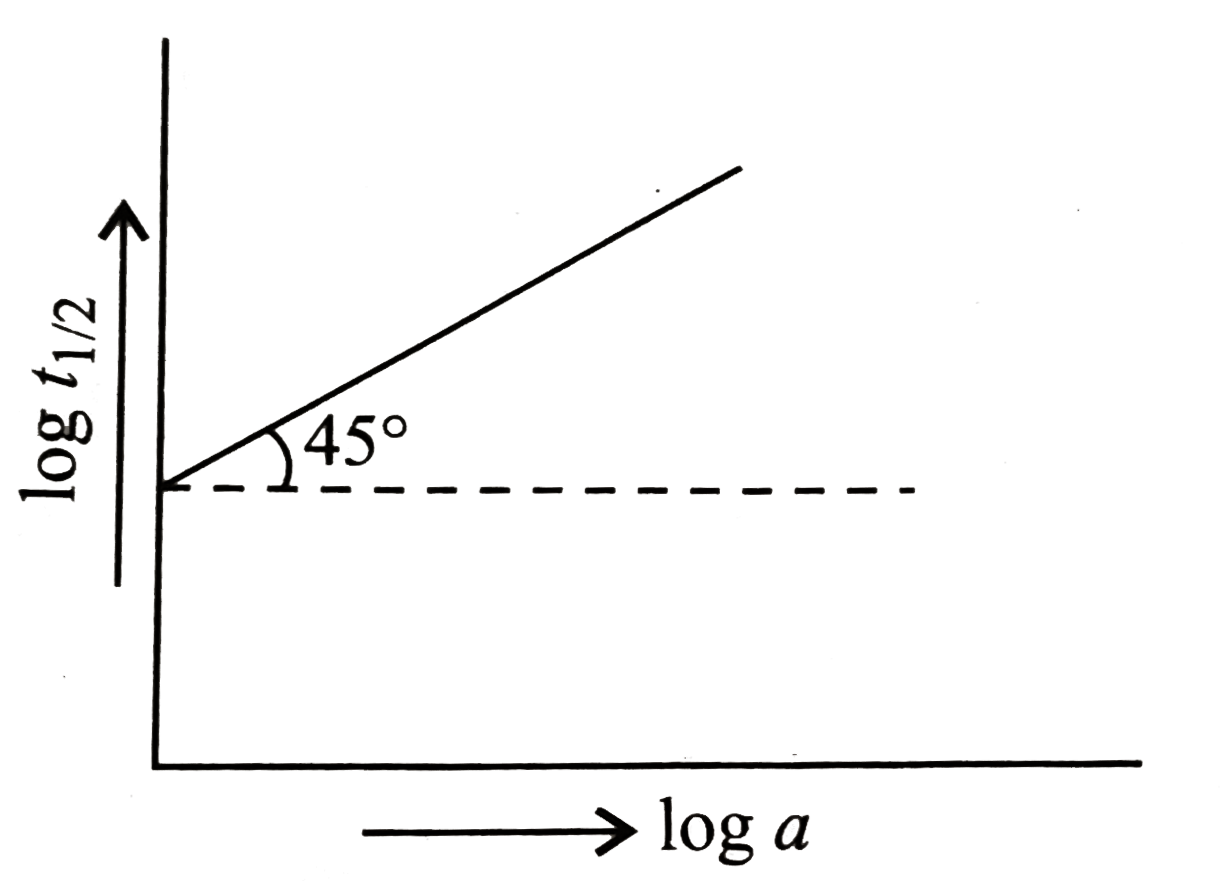
A graph plotted between log t50% vs log concentration is a straight line. What conclusion can you draw from this graph?
n=1,t12=1k.a
n=2,t12=1a
n=1,t12=0.693k
None of these
The correct Answer is:C
Step by step video & image solution for A graph plotted between log t_(50%) vs log concentration is a straight line. What conclusion can you draw from this graph? by Chemistry experts to help you in doubts & scoring excellent marks in Class 12 exams.
Similar Questions
Knowledge Check
- Question 1 - Select One
A plot of log (a-x) against time 't' is a straight line. This indicates that the reaction is of :
Azero orderBfirst orderCsecond orderDthird order
A graph plotted between logk versus 1/T for calculating activation energy is shown by
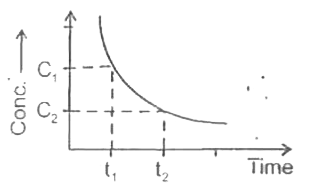
View SolutionThe graph plotted between concentration versus time
 View Solution
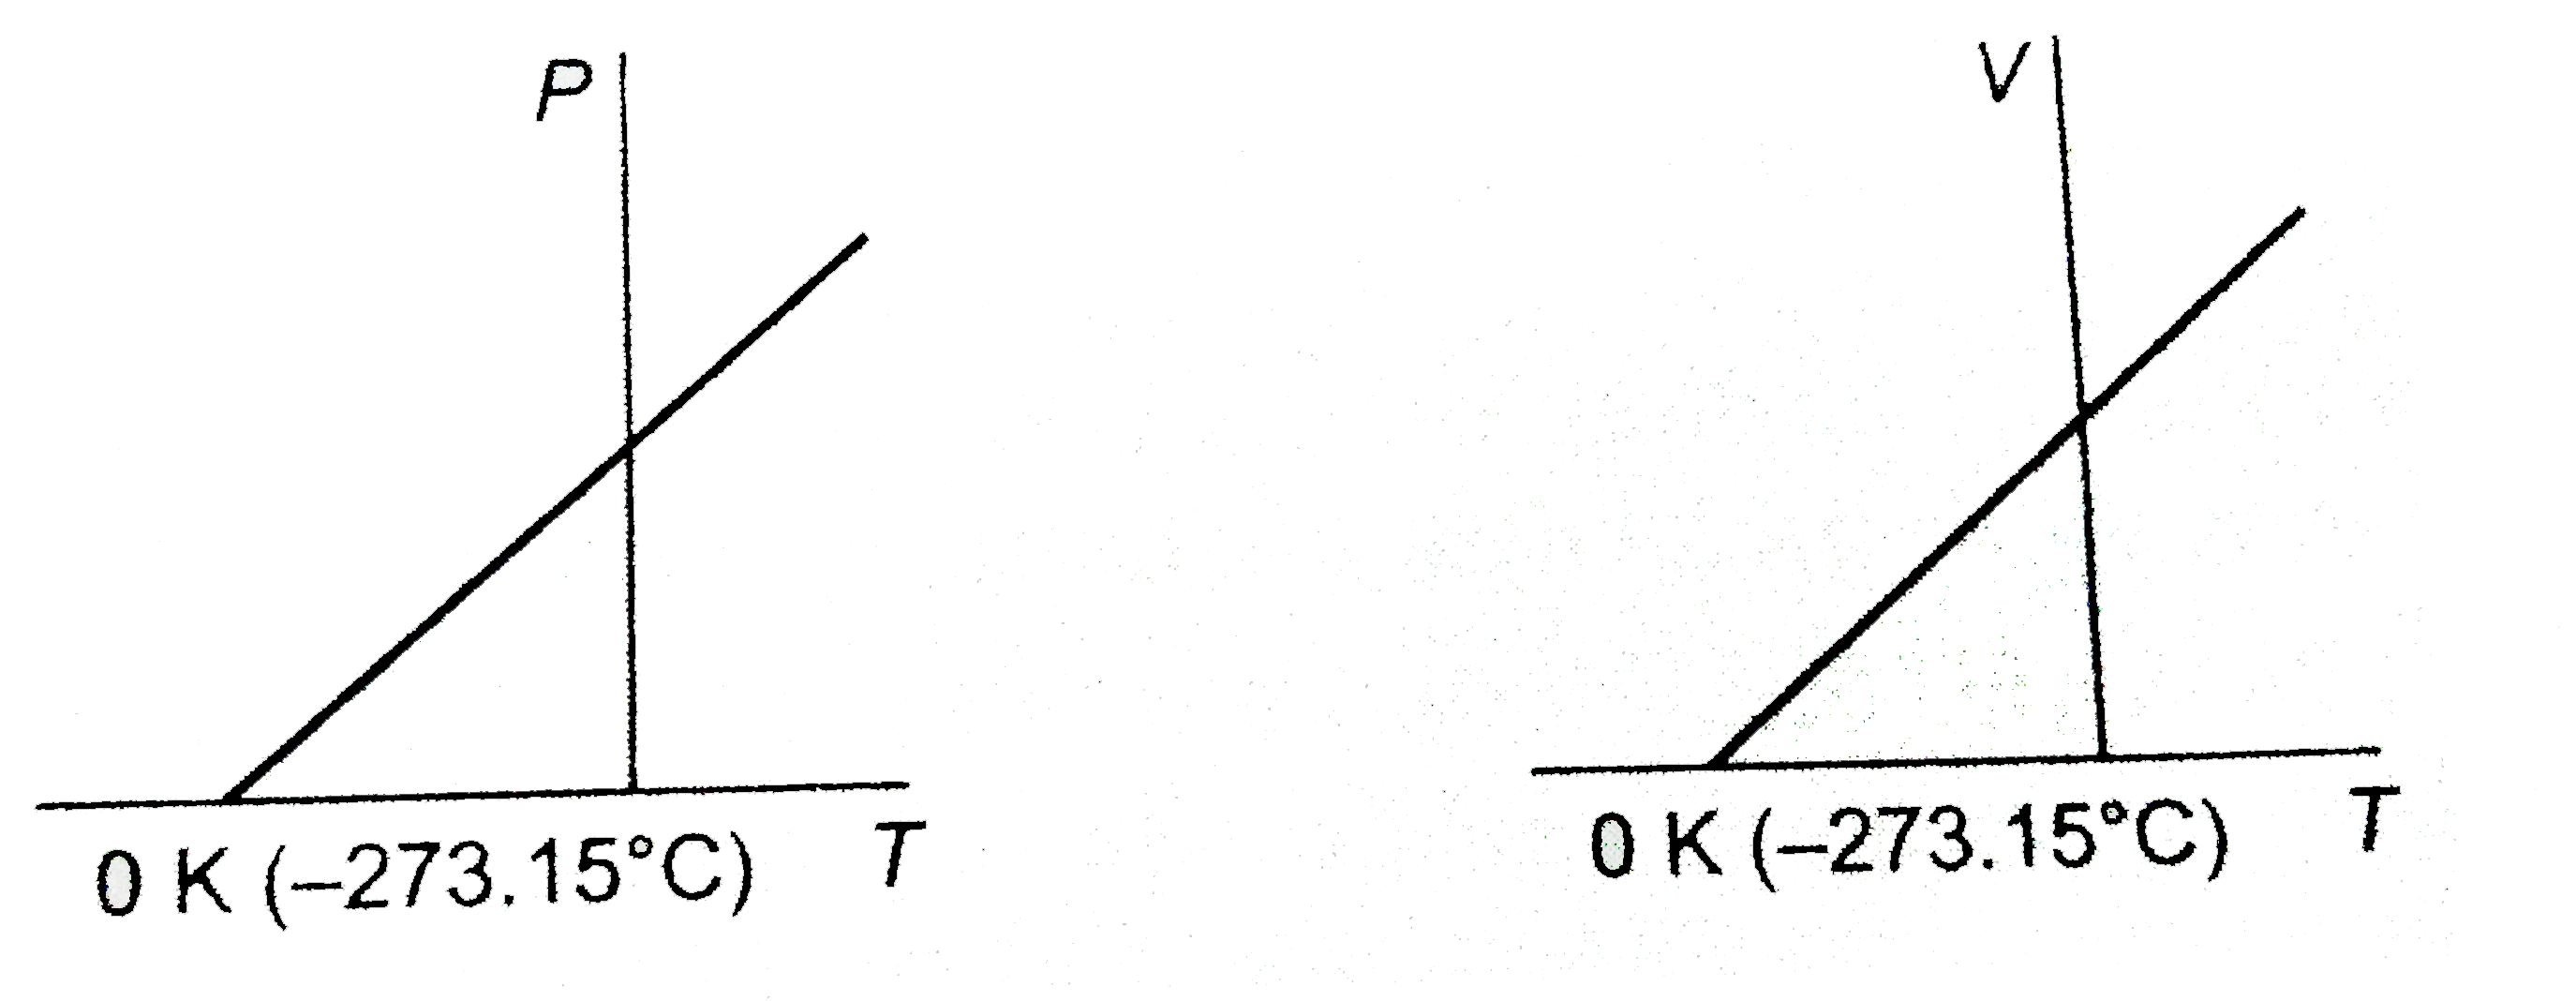
What conclusion would you draw from the following graphs for an ideal gas?
 View Solution
The graph between logk versus 1/T is a straight line.
View SolutionWhen a graph is plotted between log x/m and log p, it is straight line with an angle 45∘ and intercept 0.3010 on y− axis . If initial pressure is 0.3 atm, what wil be the amount of gas adsorbed per gm of adsorbent :
View SolutionWhen a graph is plotted between log x/m and log p, it is straight line with an angle 45∘ and intercept 0.6020 on y-axis.if initial pressure is 0.3 atm, what will be the amount of gas adsorbed per gram of adsorbent :
View SolutionFollowing is the graph between logT50 and loga (a= initial concentration) for a given reaction at 27∘C. Hence order is
 View Solution


