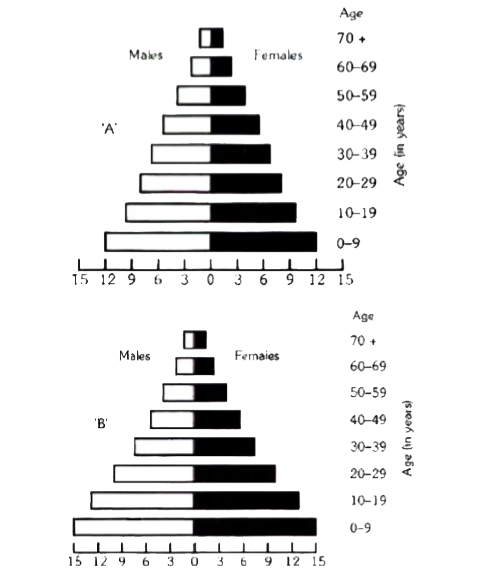
A country with a high rate of population growth took measures to reduce it. The figure below shows agesex pyramids of populations A and B twenty years apart. Select the correct interpretation about them:
6
4
3
2
Step by step video & image solution for A country with a high rate of population growth took measures to reduce it. The figure below shows agesex pyramids of populations A and B twenty years apart. Select the correct interpretation about them: by Maths experts to help you in doubts & scoring excellent marks in Class 10 exams.
Topper's Solved these Questions
- BOOK - EDUCART PUBLICATIONCHAPTER - SAMPLE PAPER SELF ASSESSMENT 11EXERCISE - Section (iii)8videos
SAMPLE PAPER SELF ASSESSMENT 11
- BOOK - EDUCART PUBLICATIONCHAPTER - SAMPLE PAPER SELF ASSESSMENT 11EXERCISE - Section (iv)13videos
SAMPLE PAPER SELF ASSESSMENT 11
- BOOK - EDUCART PUBLICATIONCHAPTER - SAMPLE PAPER SELF ASSESSMENT 11EXERCISE - Section (iv)13videos
SAMPLE PAPER SELF ASSESSMENT 11
- BOOK - EDUCART PUBLICATIONCHAPTER - SAMPLE PAPER 9 (SELF-ASSESSMENT)EXERCISE - Section-C (Case Study Based Questions)10videos
SAMPLE PAPER 9 (SELF-ASSESSMENT)
- BOOK - EDUCART PUBLICATIONCHAPTER - SAMPLE PAPER SOLVED 10EXERCISE - PART - B ( SECTION - V )5videos
SAMPLE PAPER SOLVED 10
Similar Questions
Knowledge Check
- Question 1 - Select One
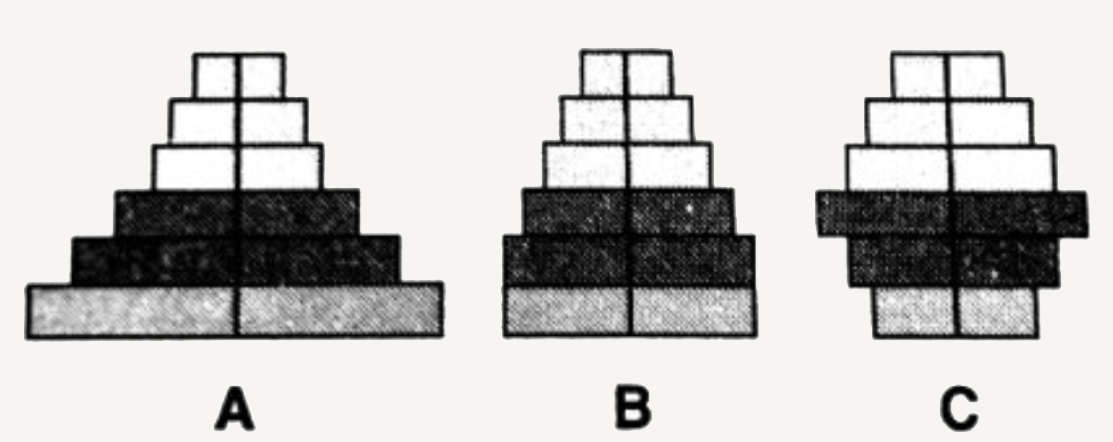
Representation of age pyramids for human population is given below. Identify A, B and C by selecting the correct option:
 AABCDecliningStableExpandingBABCStableExpandingDecliningCABCExpandingStableDecliningDABCStableDecliningExpanding
 - Question 2 - Select One
The figures given below show the types of coelom. Identify them and select the correct group of organisms which possess them.
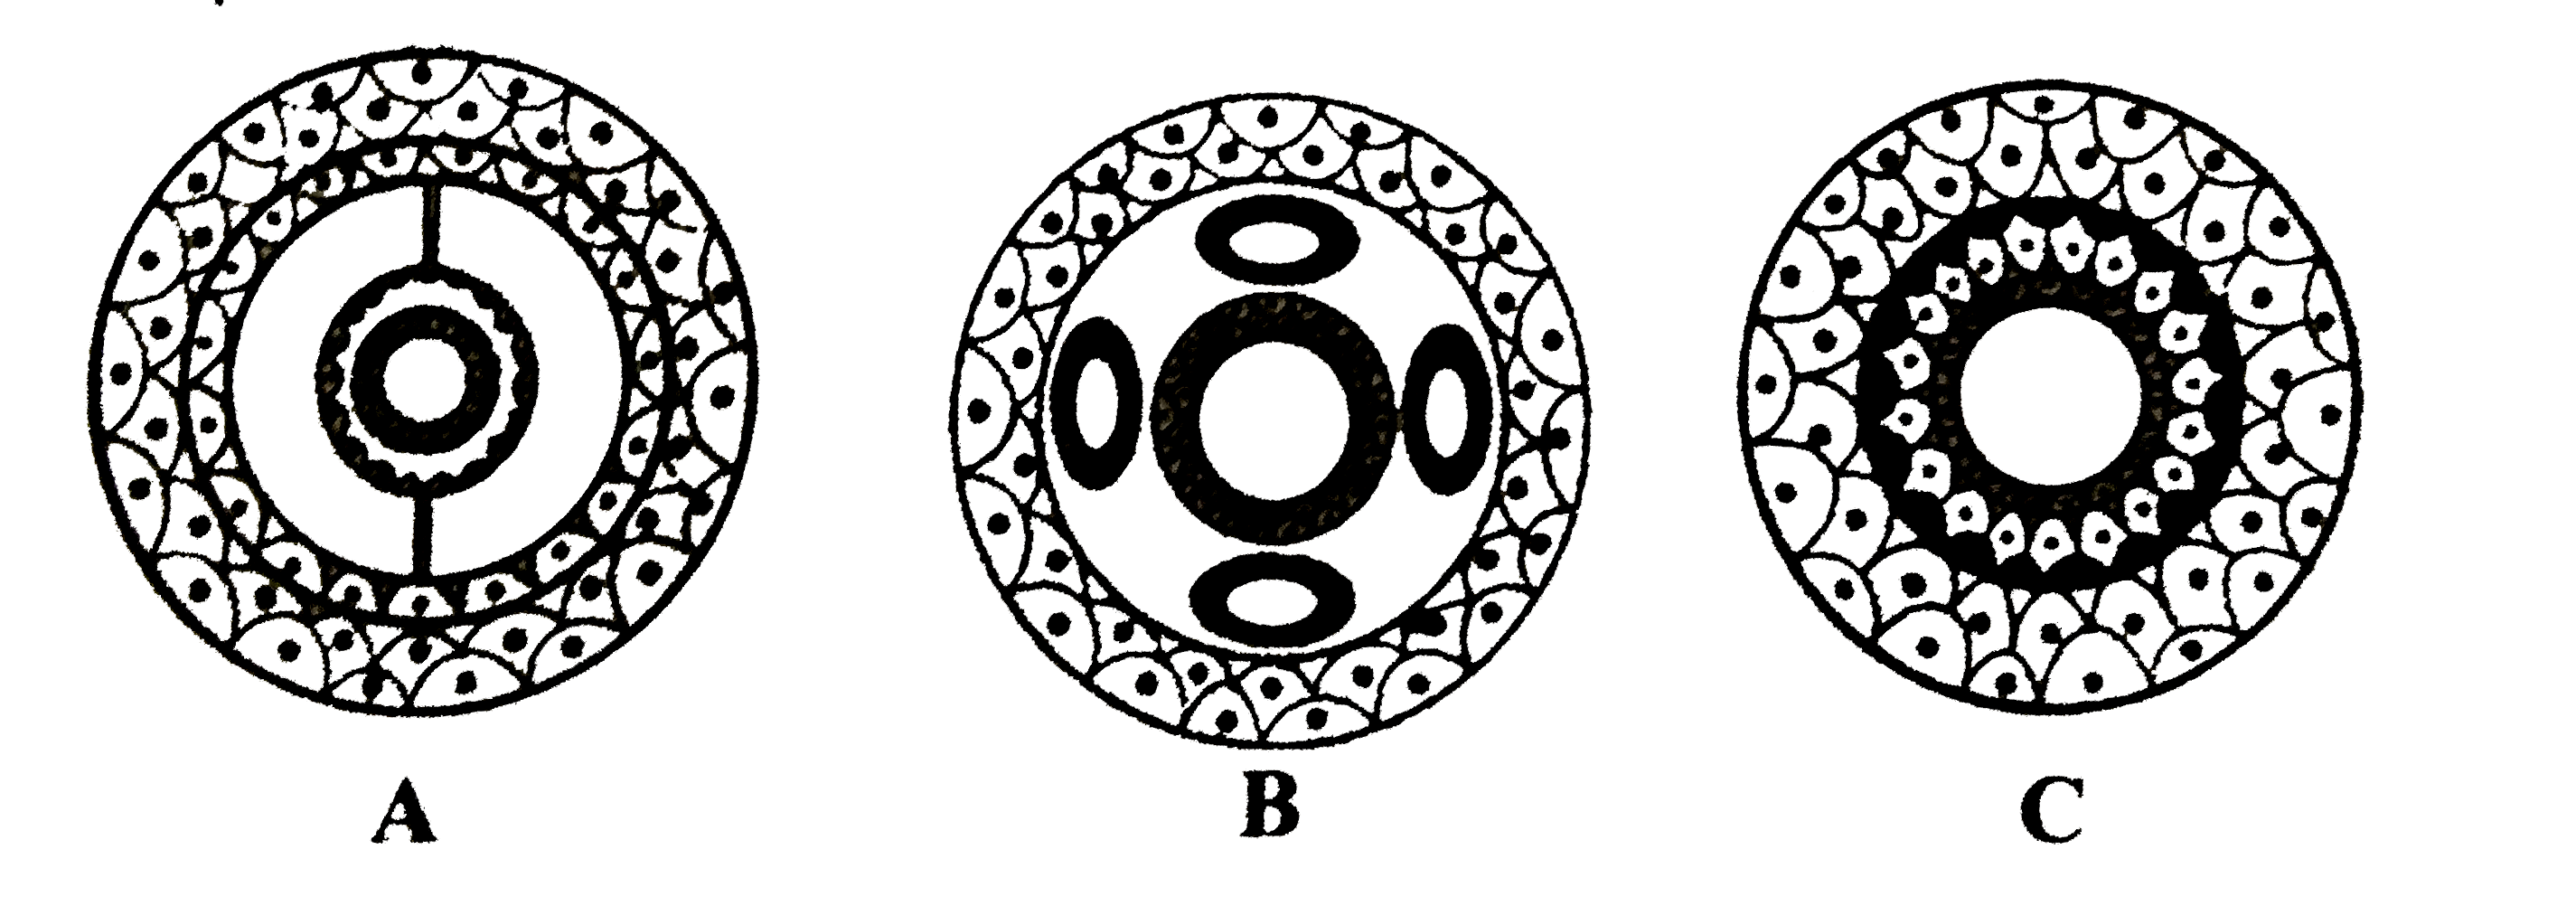 AABCAnnelidsAscheliminthesPlatyhelimthesBABCMolluscsArthropodsPlatyhelimthesCABCEchinodermsAschelminthesAnnelidsDABCEchinodermsArthropodsPlatyhelminthes
 - Question 3 - Select One
The figure below shows development of follicles (A, B, C, D). Select the option giving correct identification together with its function?
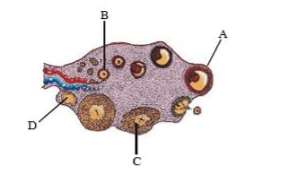 AB – Secondary Follicle – secretes progesteroneBD – Corpus albicans – Secretes estrogenCA – Tertiary follicle – Secretes FSH & LHDC – Corpus luteum – Secretes progesterone
Representation of age pyramids for the human population is given below. Identify A, B, and C by selecting the correct option .
 View Solution
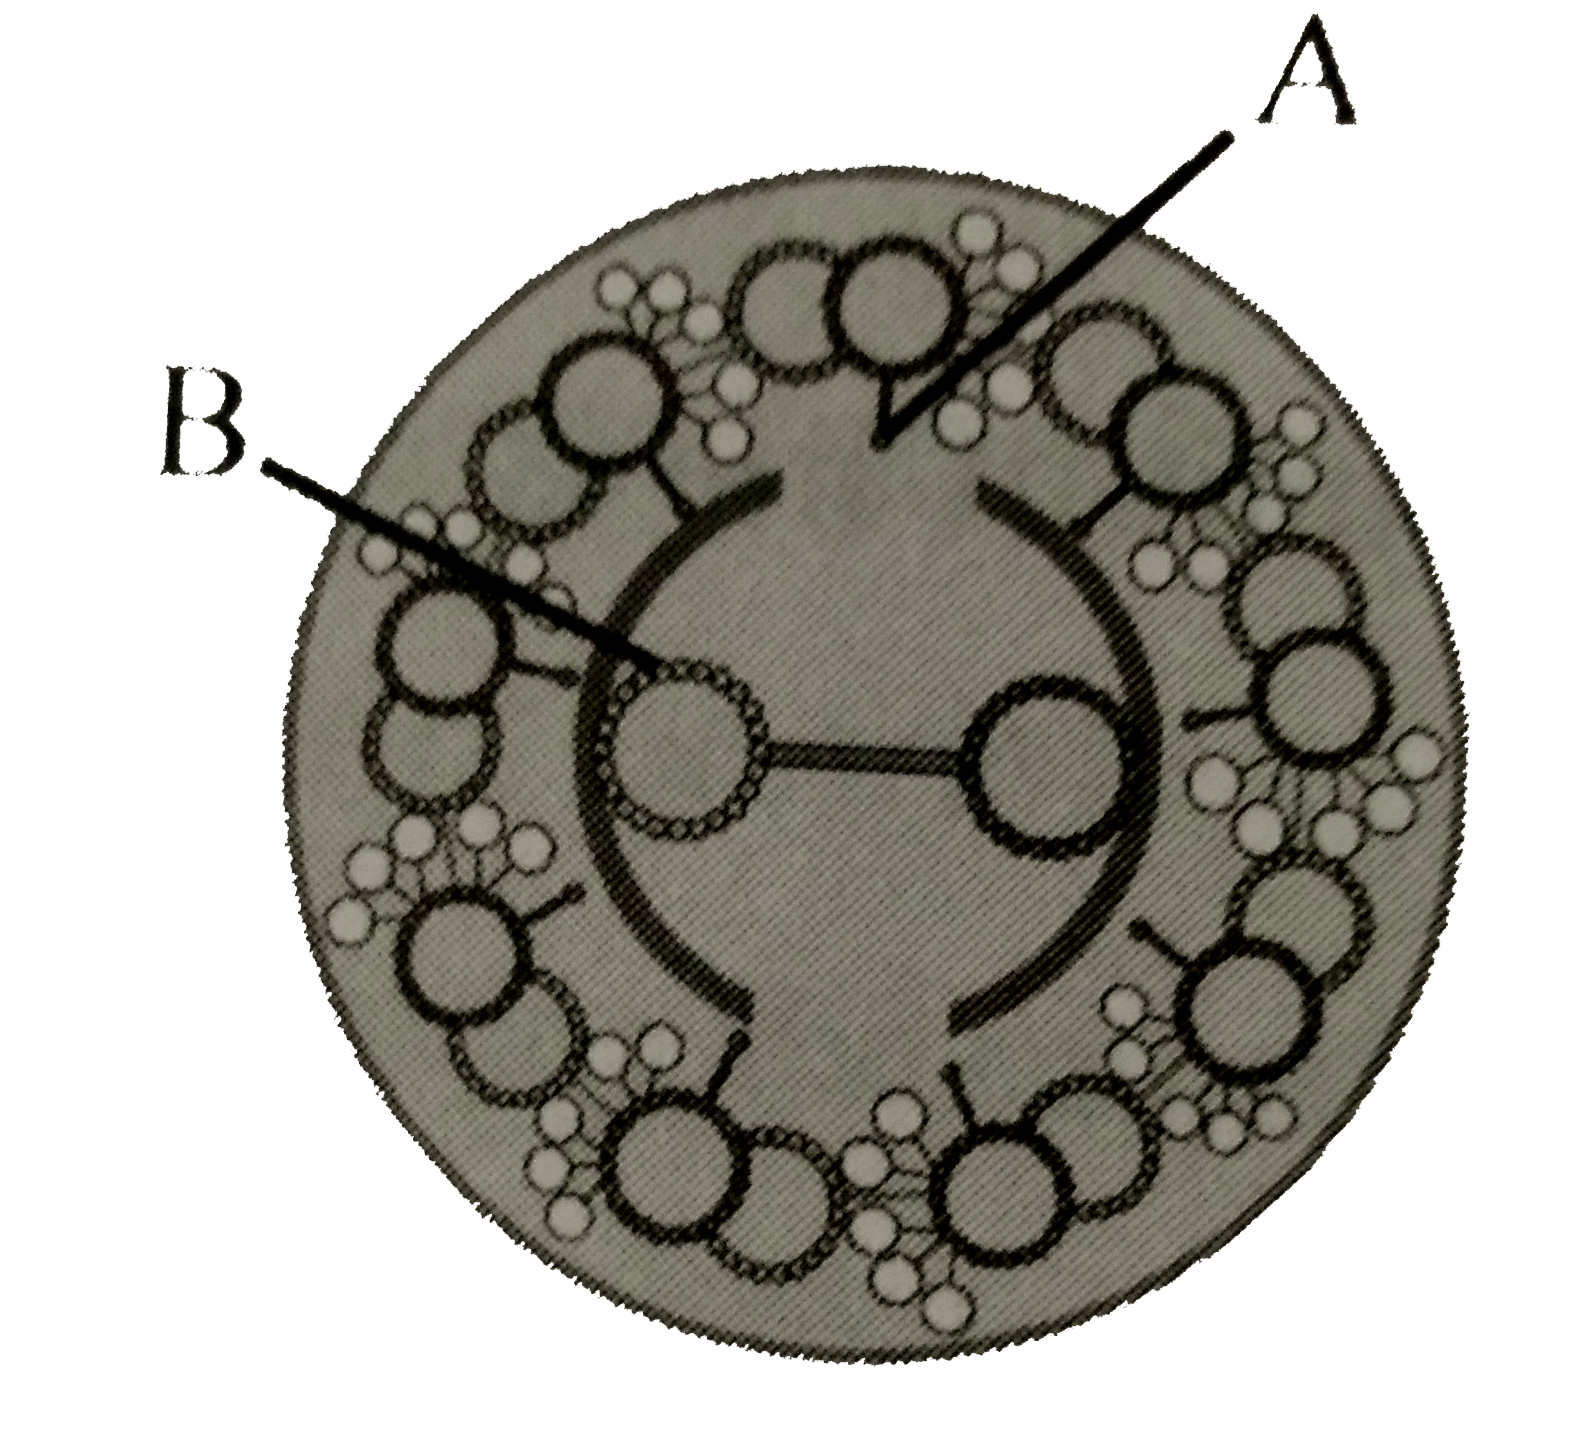
The figure below shows the section of a cillia/flagella showing different parts labelled A and B select the correct labelled name ?
 View Solution
Many population colonising a new habitat show a logistic population growth pattern over time, as shown in the figure below.
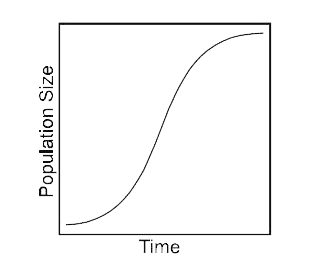
In such a population, the POPULATION growth rateView SolutionRead the following text and answer the following question on the basis of the same :
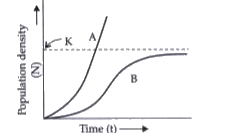
Growth of population with time shows specific and predictable patters. Two types of growth patter of populaiton are exponetial and logistic growth . When resource in the habitat are unlimited each species has the ability to relize fully its innate potential to grow in number . Then the population gorws in exponential fashion . When the resource are limited growth curve shows an inital slow rate and then it accelerates and finally slows giving the gorwth curve which is sigmoid .
Study the population growth curves (A and B) in the given graph and select the incorrect statement :
 View Solution
Read the following text and answer the following question on the basis of the same :
Growth of population with time shows specific and predictable patters. Two types of growth patter of populaiton are exponetial and logistic growth . When resource in the habitat are unlimited each species has the ability to relize fully its innate potential to grow in number . Then the population gorws in exponential fashion . When the resource are limited growth curve shows an inital slow rate and then it accelerates and finally slows giving the gorwth curve which is sigmoid .
Identify the correct equation that represents the exponential population growth curve:View Solution


