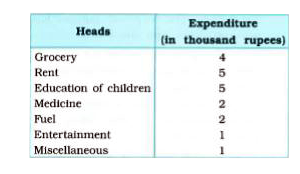
A family with a monthly income of Rs. 20,000 had planned the following expenditures per month unders various heads :

Draw a bar graph for the data above. Solution in Gujrati
Step by step video & image solution for A family with a monthly income of Rs. 20,000 had planned the following expenditures per month unders various heads : Draw a bar graph for the data above. by Maths experts to help you in doubts & scoring excellent marks in Class 9 exams.
Updated on:21/07/2023Topper's Solved these Questions
- STATISTICSBOOK - KUMAR PRAKASHANCHAPTER - STATISTICSEXERCISE - SKILL TESTING EXERCISE
21 Videos
- STATISTICSBOOK - KUMAR PRAKASHANCHAPTER - STATISTICSEXERCISE - MULTIPLE CHOICE QUESTIONS
12 Videos
- STATISTICSBOOK - KUMAR PRAKASHANCHAPTER - STATISTICSEXERCISE - EXERCISE 14.4
6 Videos
- QUESTION PAPER 3 : FOR THE ANNUAL EXAMINATION BOOK - KUMAR PRAKASHANCHAPTER - QUESTION PAPER 3 : FOR THE ANNUAL EXAMINATION EXERCISE - SECTION -D
5 Videos
- SURFACE AREAS AND VOLUMESBOOK - KUMAR PRAKASHANCHAPTER - SURFACE AREAS AND VOLUMESEXERCISE - MULTIPLE CHOICE QUESTIONS
18 Videos
Similar Questions
The marks scored by 40 students in a Mathematics test are given below:

Prepare the frequency distribution with classes 0-4, 5-9.....
View SolutionThe marks scored by Kavya in 10 tests of Mathematics are 35. 18, 41, 24, 45, 10, 28, 32, 40, 15. Then, the range of the data is.......
View SolutionThe following number of goals were scored by a team in a series of 10 matches : 2, 3, 4, 5, 0, 1, 3, 3, 4, 3 Find the mean, median and mode of these scores.
View SolutionProve that the angles opposite to equal sides of an isosceles triangle are equal.
View SolutionThe total surface area of a cuboid with length 20 cm, breadth 15 cm and height 10 cm is ……… cm2.
View SolutionA family with a monthly income of Rs 20,000 had planned the following expenditures per month under various heads
View SolutionHow many lines of symmetry does the above figure have ?
View SolutionDetermine the point of symmetry of a regular hexagon.
View SolutionDtermine the images of the following figure about the given line :
View SolutionDraw the bisector of ∠AOB=58∘
ltimg src="https://d10lpgp6xz60nq.cloudfront.net/physics_images/PS_MATH_VII_C05_S01_009_Q01.png" width="80%"gt
View SolutionMatch the following Column A to Column B

View SolutionMatch the following Column A to Column B

View SolutionMatch the following Column A to Column B

View SolutionThe inequation represented by the graph given below is :
View SolutionThe inequation that best describes the graph given below is _________
View Solution
