A frequency polygon is constructed by plotting frequency of the class interval and the (a) upper limit of the class (b) lower limit of the class (c) mid value of the class (d) any values of the class
To solve the question regarding how a frequency polygon is constructed, we will go through the definition and the options provided step by step.
1. Understanding Frequency Polygon:
A frequency polygon is a graphical representation of the distribution of a dataset. It is created by plotting the frequencies of different class intervals.
Hint: Remember that a frequency polygon is a type of graph that represents frequency distributions.
2. Identifying Key Components:
To create a frequency polygon, we need to identify the points that will be plotted. These points are derived from the class intervals.
Hint: Think about what values from the class intervals can be used to represent the frequency.
3. Choosing the Correct Value:
The frequency polygon is constructed by plotting the frequencies against the midpoints of each class interval. The midpoint of a class interval is calculated as the average of the upper and lower limits of that interval.
Hint: Consider how midpoints are calculated and why they are significant for representing the data.
4. Analyzing the Options:
Now, let's evaluate the options given in the question:
- (a) Upper limit of the class
- (b) Lower limit of the class
- (c) Mid value of the class (this refers to the midpoint)
- (d) Any values of the class
From our understanding, the correct choice is (c) Mid value of the class, as it directly refers to the midpoints used in constructing the frequency polygon.
Hint: Focus on the term "mid value," which is synonymous with the midpoint.
5. Final Answer:
Therefore, the correct answer to the question is (c) mid value of the class.
Summary of the Solution:
A frequency polygon is constructed by plotting the frequency of the class interval against the midpoints of the class intervals. Thus, the correct answer is (c) mid value of the class.
A frequency polygon is a graphical representation of the distribution of a dataset. It is created by plotting the frequencies of different class intervals.
To create a frequency polygon, we need to identify the points that will be plotted. These points are derived from the class intervals.
The frequency polygon is constructed by plotting the frequencies against the midpoints of each class interval. The midpoint of a class interval is calculated as the average of the upper and lower limits of that interval.
Now, let's evaluate the options given in the question:
- (a) Upper limit of the class
- (b) Lower limit of the class
- (c) Mid value of the class (this refers to the midpoint)
- (d) Any values of the class
Therefore, the correct answer to the question is (c) mid value of the class.
A frequency polygon is constructed by plotting the frequency of the class interval against the midpoints of the class intervals. Thus, the correct answer is (c) mid value of the class.
Topper's Solved these Questions
Similar Questions
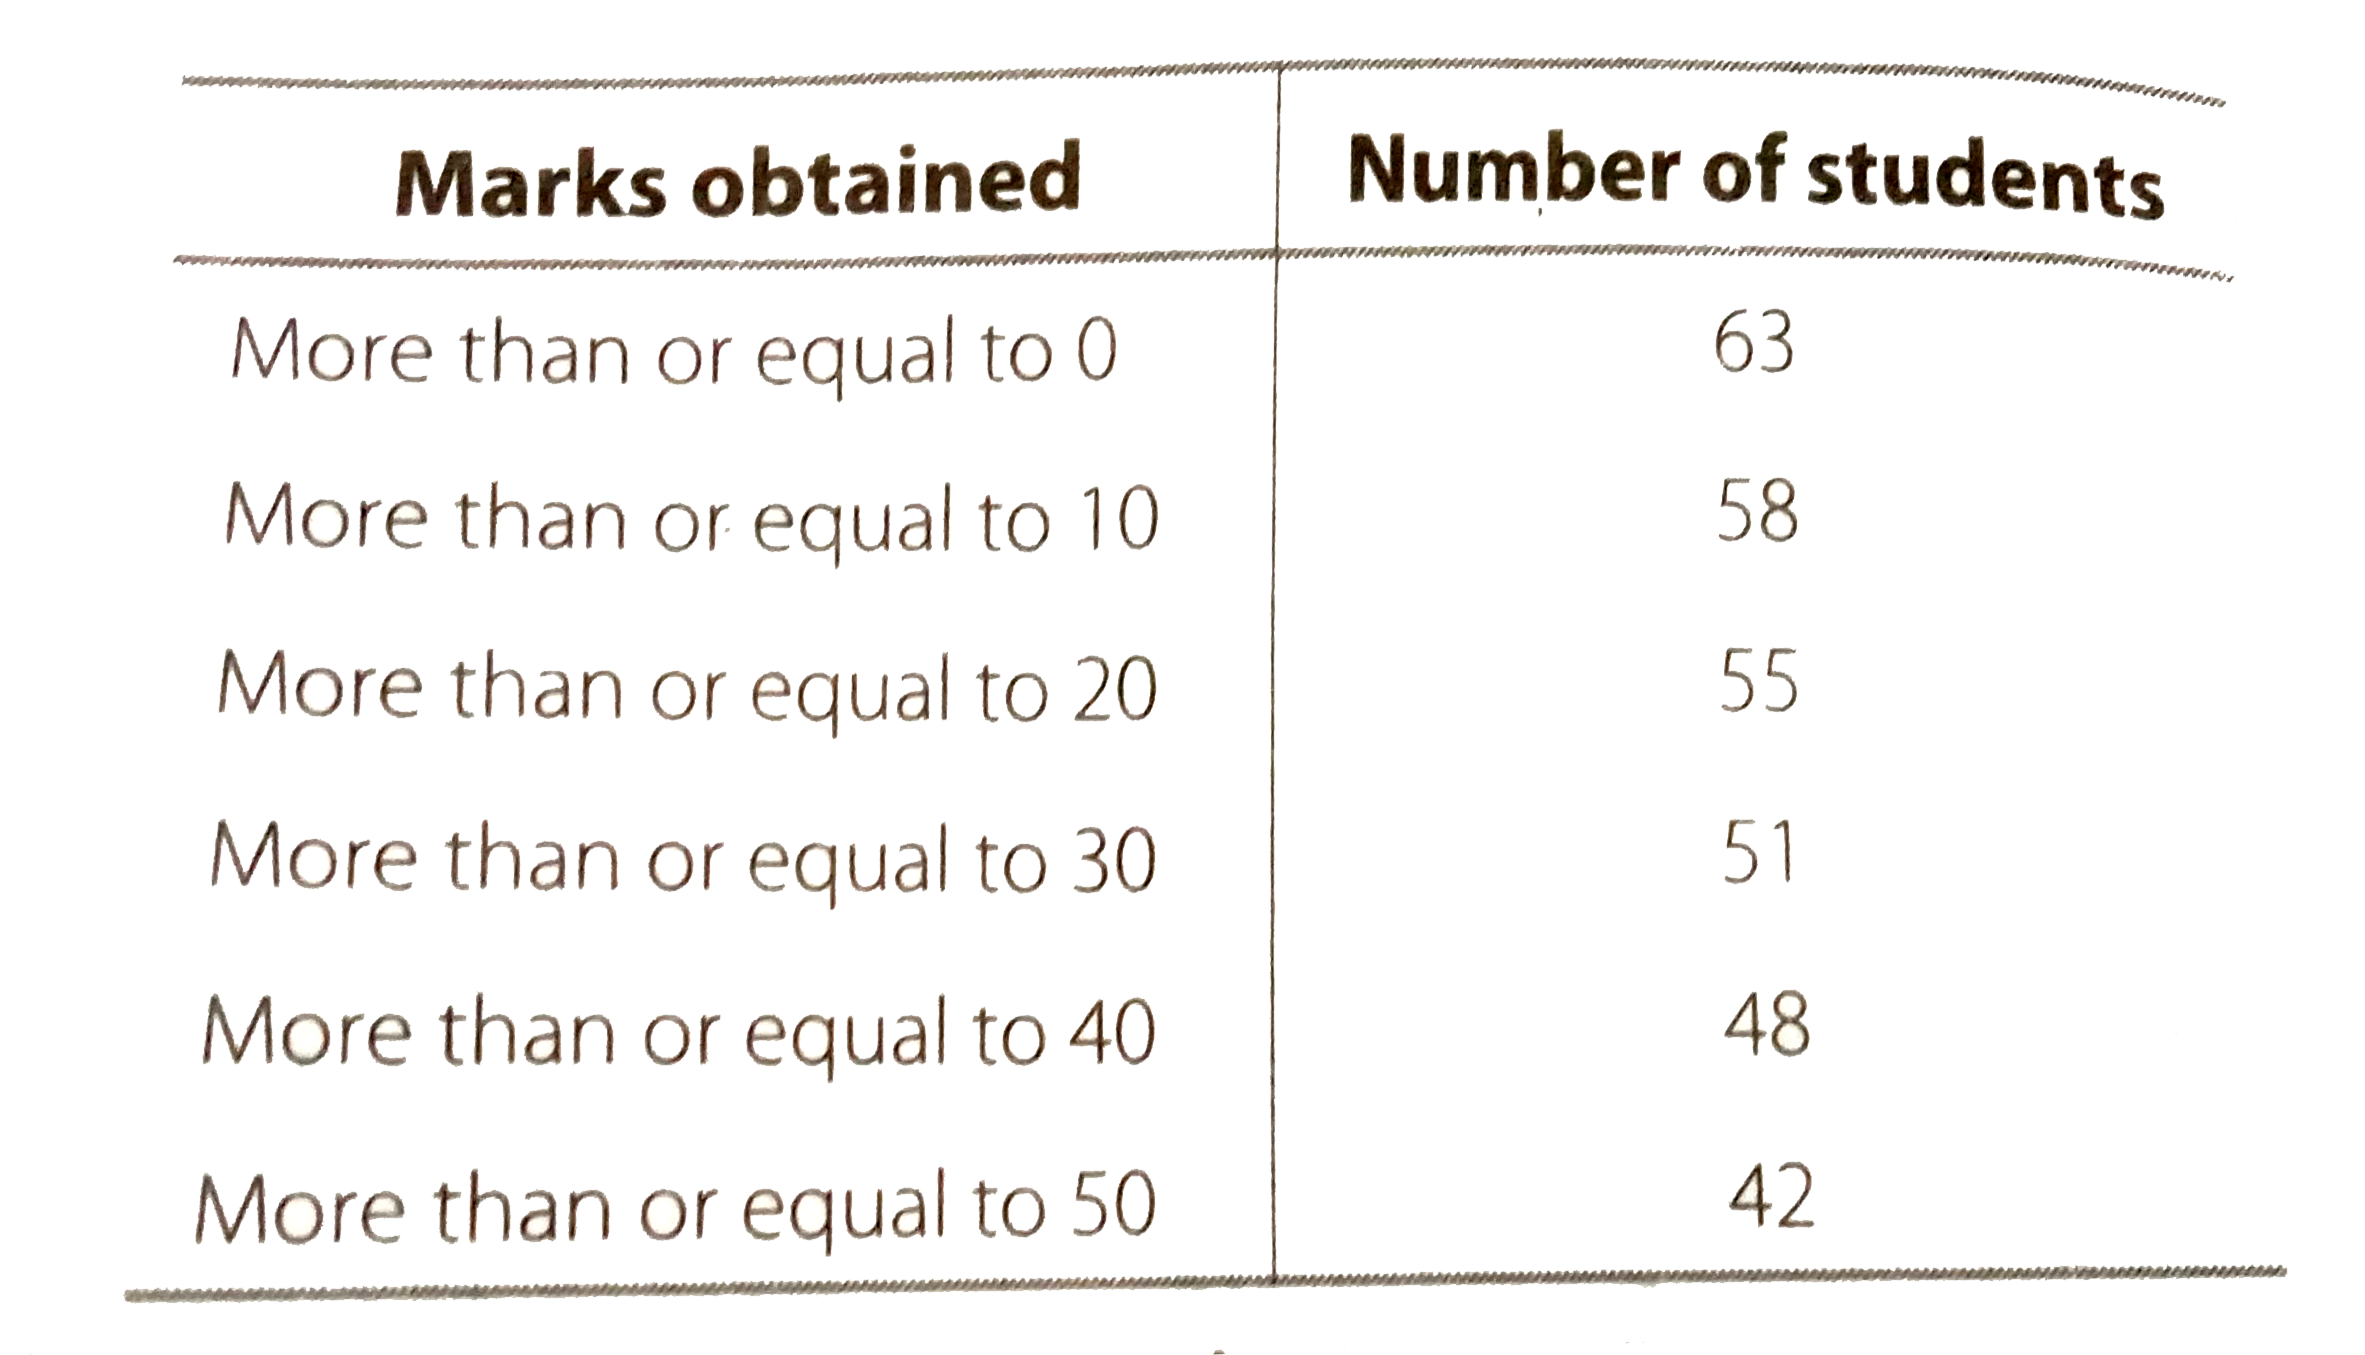
Write the comulative frequency of class interval 30-40

View SolutionConsider the data

The frequency of the upper limit of the median class and the lower limit of the modal class is
View SolutionFrom the following frequency table.

Find : (a) The frequency of fifth class interval
(b) The upper class limit of third class interval.
(c) The lower class limit of second class interval.
(d) The class mark of sixth class interval.
View SolutionIn a frequency distribution, the mid values of a class is 10 and width of the class is 6. The lower limit of the class is
View SolutionThe table given below shows a frequency distribution table, find
(a) Upper limit of third class (b) Lower limit of fifth class
(c) Class size (d) Class mark of third class

View SolutionFor the following frequency distribution

The upper limit of median class is
View SolutionIn a histogram, each class rectangle is constructed with base as frequency (b) class intervals range (d) size of the class
View SolutionConsider the following frequency distribution

The upper limit of the median class in
View SolutionTally marks are used to find
(a) class interval (b) range
(c) frequency (d) upper limit
View SolutionConsider the following distribution

Frequency of the class 30-40 is
View Solution
