A marketing team conducted a study on the use of smartphones. In a certain metropolitan area, there were 1.6 million smartphone users at the end of 2018. The marketing team predicted that the number of smartphone users would increase by 35 percent each year beginning in 2019. If y represents the number of smartphone users in this metropolitan area after x years, then which of the following equations best models the number of smartphone users in this area over time ?
y=1,600,000(1.35)x
y=1,600,000(35)x
y=35+1,600,000
y=1.35x+1,600,000
The correct Answer is:A
To model the number of smartphone users in a metropolitan area over time, we can follow these steps:
1. Identify Initial Users:
At the end of 2018, the number of smartphone users is given as 1.6 million. This can be represented as:
A0=1.6 million=1,600,000
2. Determine the Growth Rate:
The problem states that the number of smartphone users is expected to increase by 35% each year. This percentage can be converted into a decimal for calculations:
R=35%=35100=0.35
3. Set Up the Growth Formula:
The formula for exponential growth when a quantity increases by a certain percentage each year is:
Y=A0×(1+R)x
where Y is the number of users after x years, A0 is the initial quantity, R is the growth rate, and x is the number of years.
4. Substitute the Known Values:
Now, substitute A0 and R into the formula:
Y=1,600,000×(1+0.35)x
This simplifies to:
Y=1,600,000×(1.35)x
5. Final Equation:
Thus, the equation that models the number of smartphone users in the metropolitan area after x years is:
Y=1,600,000×(1.35)x
Conclusion:
The equation Y=1,600,000×(1.35)x best represents the number of smartphone users in this area over time.
At the end of 2018, the number of smartphone users is given as 1.6 million. This can be represented as:
A0=1.6 million=1,600,000
The problem states that the number of smartphone users is expected to increase by 35% each year. This percentage can be converted into a decimal for calculations:
R=35%=35100=0.35
The formula for exponential growth when a quantity increases by a certain percentage each year is:
Y=A0×(1+R)x
where Y is the number of users after x years, A0 is the initial quantity, R is the growth rate, and x is the number of years.
Now, substitute A0 and R into the formula:
Y=1,600,000×(1+0.35)x
This simplifies to:
Y=1,600,000×(1.35)x
Thus, the equation that models the number of smartphone users in the metropolitan area after x years is:
Y=1,600,000×(1.35)x
The equation Y=1,600,000×(1.35)x best represents the number of smartphone users in this area over time.
Topper's Solved these Questions
- EXPONENTS, RADICALS, POLYNOMIALS, AND RATIONAL EXPRESSIONSBOOK - KAPLANCHAPTER - EXPONENTS, RADICALS, POLYNOMIALS, AND RATIONAL EXPRESSIONSEXERCISE - EXPONENTS
1 Videos
- EXPONENTS, RADICALS, POLYNOMIALS, AND RATIONAL EXPRESSIONSBOOK - KAPLANCHAPTER - EXPONENTS, RADICALS, POLYNOMIALS, AND RATIONAL EXPRESSIONSEXERCISE - POLYNOMIALS
1 Videos
- EXPONENTS, RADICALS, POLYNOMIALS, AND RATIONAL EXPRESSIONSBOOK - KAPLANCHAPTER - EXPONENTS, RADICALS, POLYNOMIALS, AND RATIONAL EXPRESSIONSEXERCISE - RATIONAL EXPRESSIONS AND EQUATIONS
1 Videos
- ANSWERING SAT READING QUESTIONS BOOK - KAPLANCHAPTER - ANSWERING SAT READING QUESTIONS EXERCISE - TRY ON YOUR OWN
22 Videos
- FUNCTIONS BOOK - KAPLANCHAPTER - FUNCTIONS EXERCISE - DESCRIBING REAL-LIFE SITUATIONS WITH FUNCTIONS
1 Videos
Similar Questions
Knowledge Check
M=1,800(1.02)t
The equation above models the number of members, M, of a gym t years after the gym opens. Of the following, which equation models the number of members of the gym q quarter years after the gym opens?AM=1,800(1.02)q4BM=1,800(1.02)4qCM=1,800(1.005)4qDM=1,800(1.082)qThe 2005 to 2015 population density of a certain town can be modeled by the equation d=21.3y+1,927.3, where y represents the number of years since 2005 and d represent the population density .Which of the following best describes the meaning of the number 21,3 in the equation?
AThe estimated difference between the population density in 2005 and 2015.BThe estimated increase in the population density each year.CThe population density in 2005DThe total population in 2005The population, p of a town can be modeled by the equation P=750(1.15)d, where d is the number of decades after the year 1980. Which of the following equations can be used to model the population of the town y years after 1980?
AP=750(4.046)yBP=750(1.15)10yCP=750(1.15)(y10)DP=750(1.015)10y
Which of the following contraceptive protect the user from contracting STDs and AIDS ?
View SolutionKeith modeled the growth over several hundred years of a tree population by estimating the number of the trees’ pollen grains per square centimeter that were deposited each year within layers of a lake’s sediment. He estimated there were 310 pollen grains per square centimeter the first year the grains were deposited, with a 1% annual increase in the number of grains per square centimeter thereafter. Which of the following functions models P(t), the number of pollen grains per square centimeter t years after the first year the grains were deposited?
View SolutionA User Defined Function can have _____ number of parameters
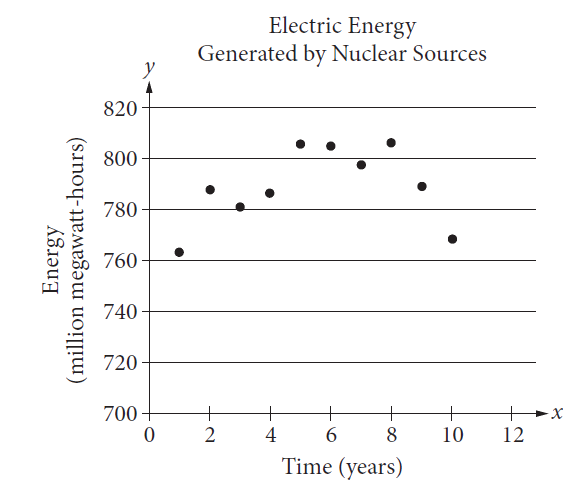
View SolutionThe scatterplot below shows the amount of electric energy generated, in millions of megawatt-hours, by nuclear sources over a 10‑year period.

Of the following equations, which best models the data in the scatterplot?
View SolutionA user defined function in Java can return _____number of values
View Solution
