A survey was made to find the type of music that a certain group of young people liked in a city.Adjoining pie chart shows the findings of this survey. From this pie chart answer the following:(i) If 20 people liked classical music, how many young people were surveyed?(ii) Which type of music is liked by the maximum number of people?
(i)10% represents20 people.
Therefore 100% represents
=100×2010=200 people
= Hence, 200 young people were surveyed.
(ii) From the pie chart,
it can be easily observed that
the light music is represented by
the maximum part of the pie chart (i.e.40%).
Hence, Light music is liked
by the maximum number of people.
(iii) Number of CD’s of classical music=10×1000100=100
Number of CD’s of semi-classical music=20×1000100=200
Number of CD’s of light music=40×1000100=400
Number of CD’s of folk music=30×1000100=300
Topper's Solved these Questions
- DATA HANDLINGBOOK - NCERT ENGLISHCHAPTER - DATA HANDLINGEXERCISE - SOLVED EXAMPLES
1 Videos
- DATA HANDLINGBOOK - NCERT ENGLISHCHAPTER - DATA HANDLINGEXERCISE - EXERCISE 5.1
5 Videos
- CUBES AND CUBE ROOTSBOOK - NCERT ENGLISHCHAPTER - CUBES AND CUBE ROOTSEXERCISE - SOLVED EXAMPLES
8 Videos
- DIRECT AND INVERSE PROPORTIONSBOOK - NCERT ENGLISHCHAPTER - DIRECT AND INVERSE PROPORTIONSEXERCISE - EXERCISE 13.1
10 Videos
Similar Questions
If 60% people in a city like cricket, 30% like football and the remaining like other games, then what per cent of the people like other games? If the total number of people are 50 lakh, find the exact number who like each type of game.
View Solution
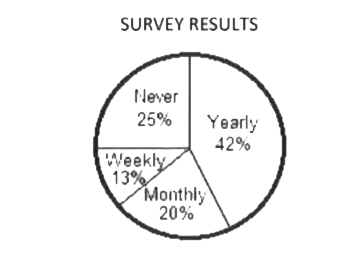
The circle graph abvoe shows the distribution of responses to a survey in which a group of people were asked how often they donate to charity. What fraction of those surveyed reported that they donate at least yearly?
View Solution
Knowledge Check
A researcher conducted a survey to determine whether people in a certain large town prefer watching sports on television to attending the sporting event. The researcher asked 117 people who visited a local restaurant on a Saturday, and 7 people refused to respond. Which of the following factors makes it least likely that a reliable conclusion can be drawn about the sports-watching preferences of all people in the town?
ASample sizeBPopulation sizeCThe number of people who refused to respondDWhere the survey was given
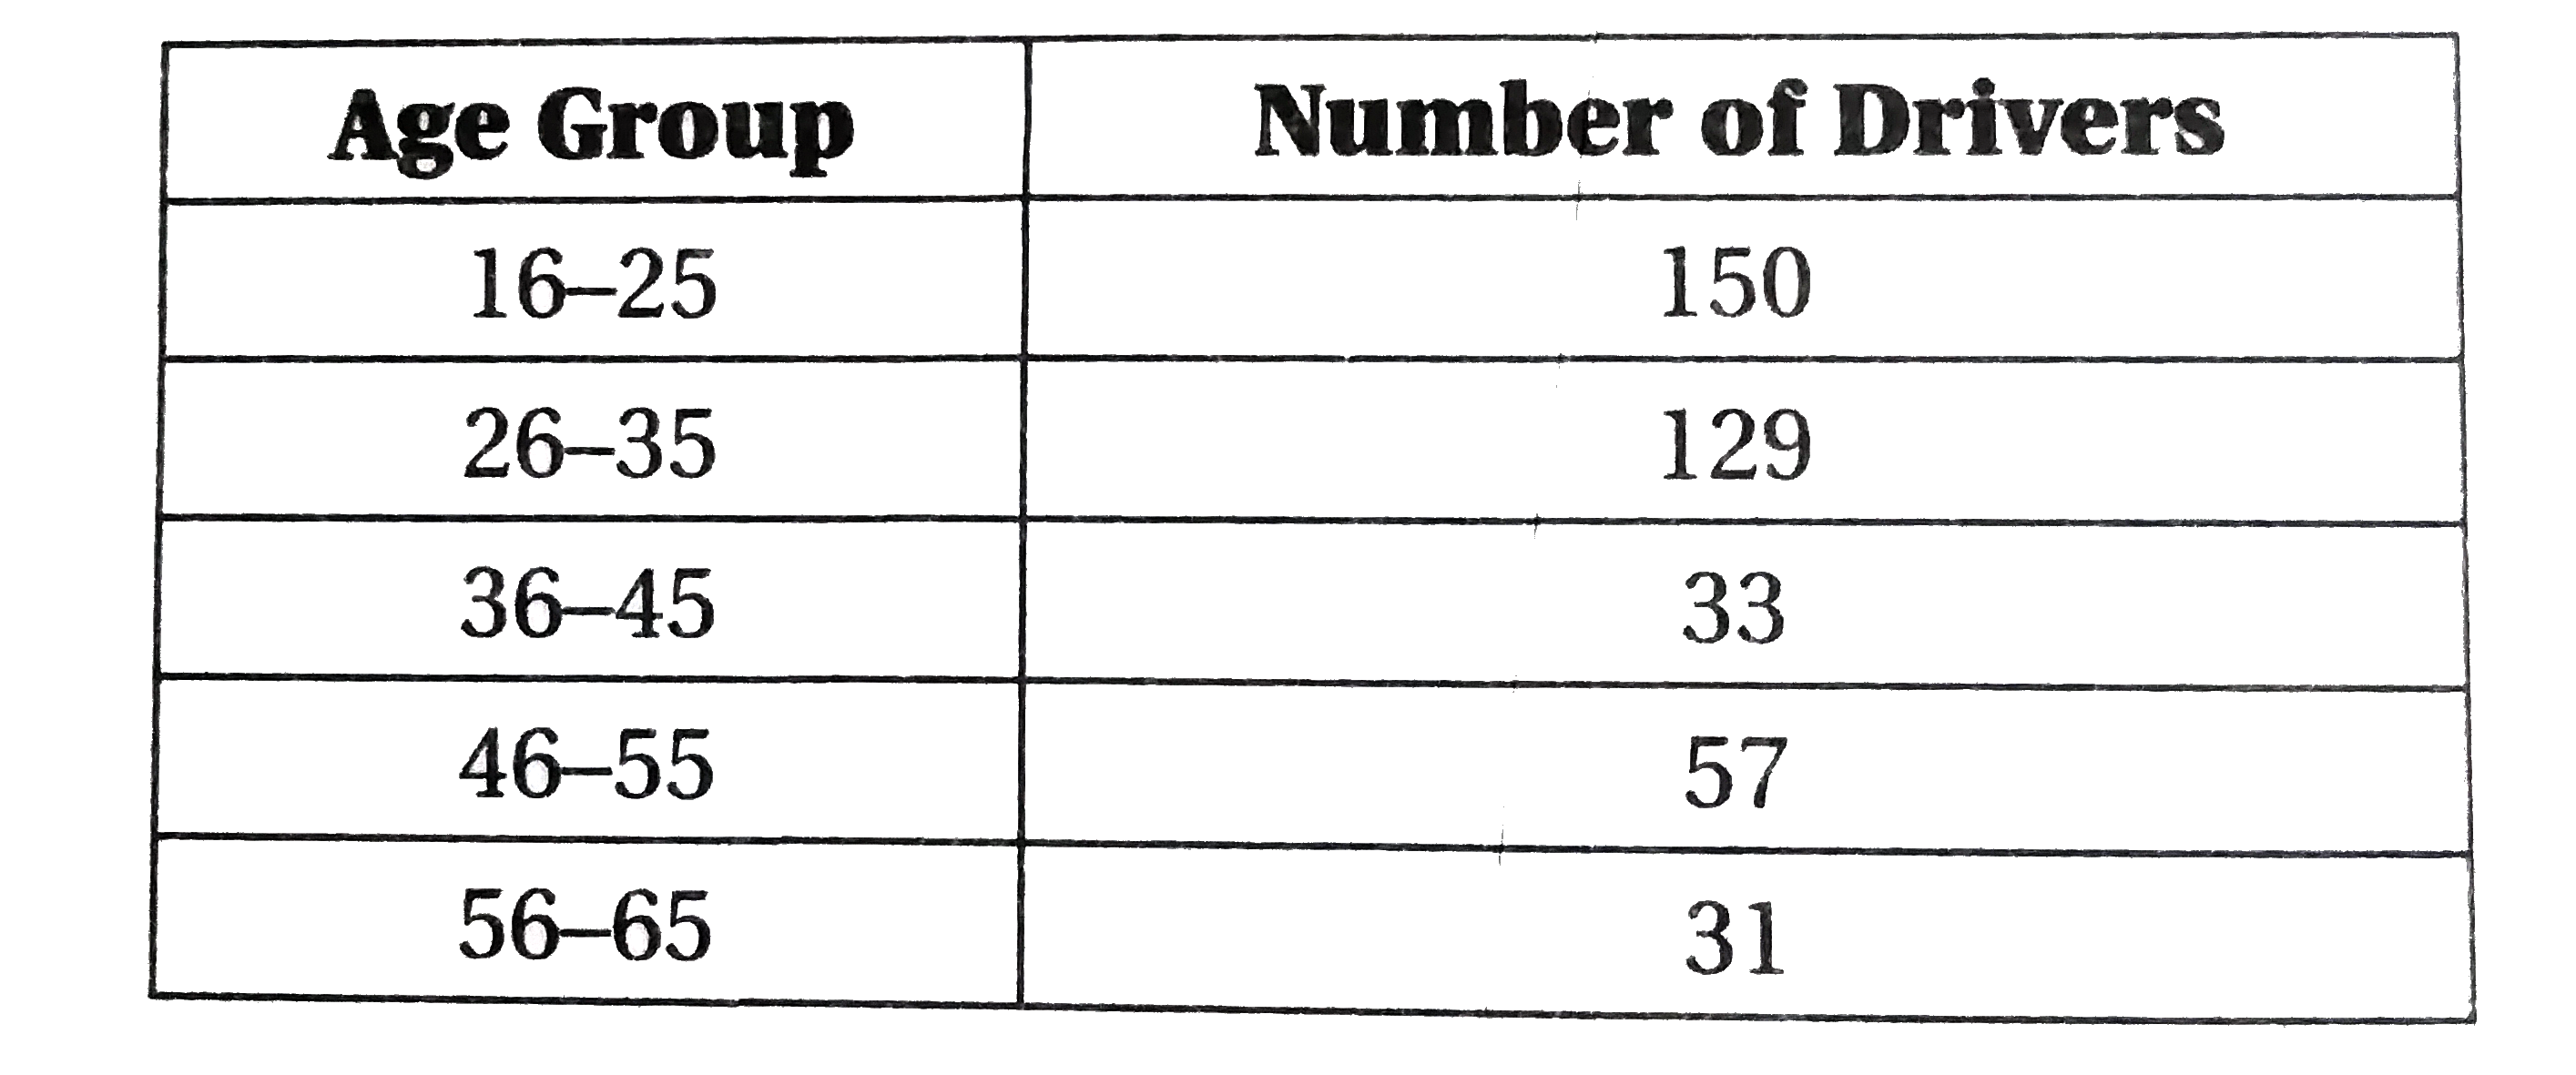
The table above summarizes the number of people by age group who were included in a survey of driving habits. Which of the following statements is true?AThe survey was not biased since different age groups were included.BThe survey was biased becouse individuals 36 and older were underrespresented.CThe survey was biased because it did not differentiate between males and femalesDThe survey was not biased since a large number of drivers were polled.In a group of 70 people, 52 like soft drinks and 37 like tea and each person likes atleast one of the two drinks. Then the number of people who like both the drinks is (i) 15 (ii) 19 (iii) 18 (iv) 20
A15B19C18D20

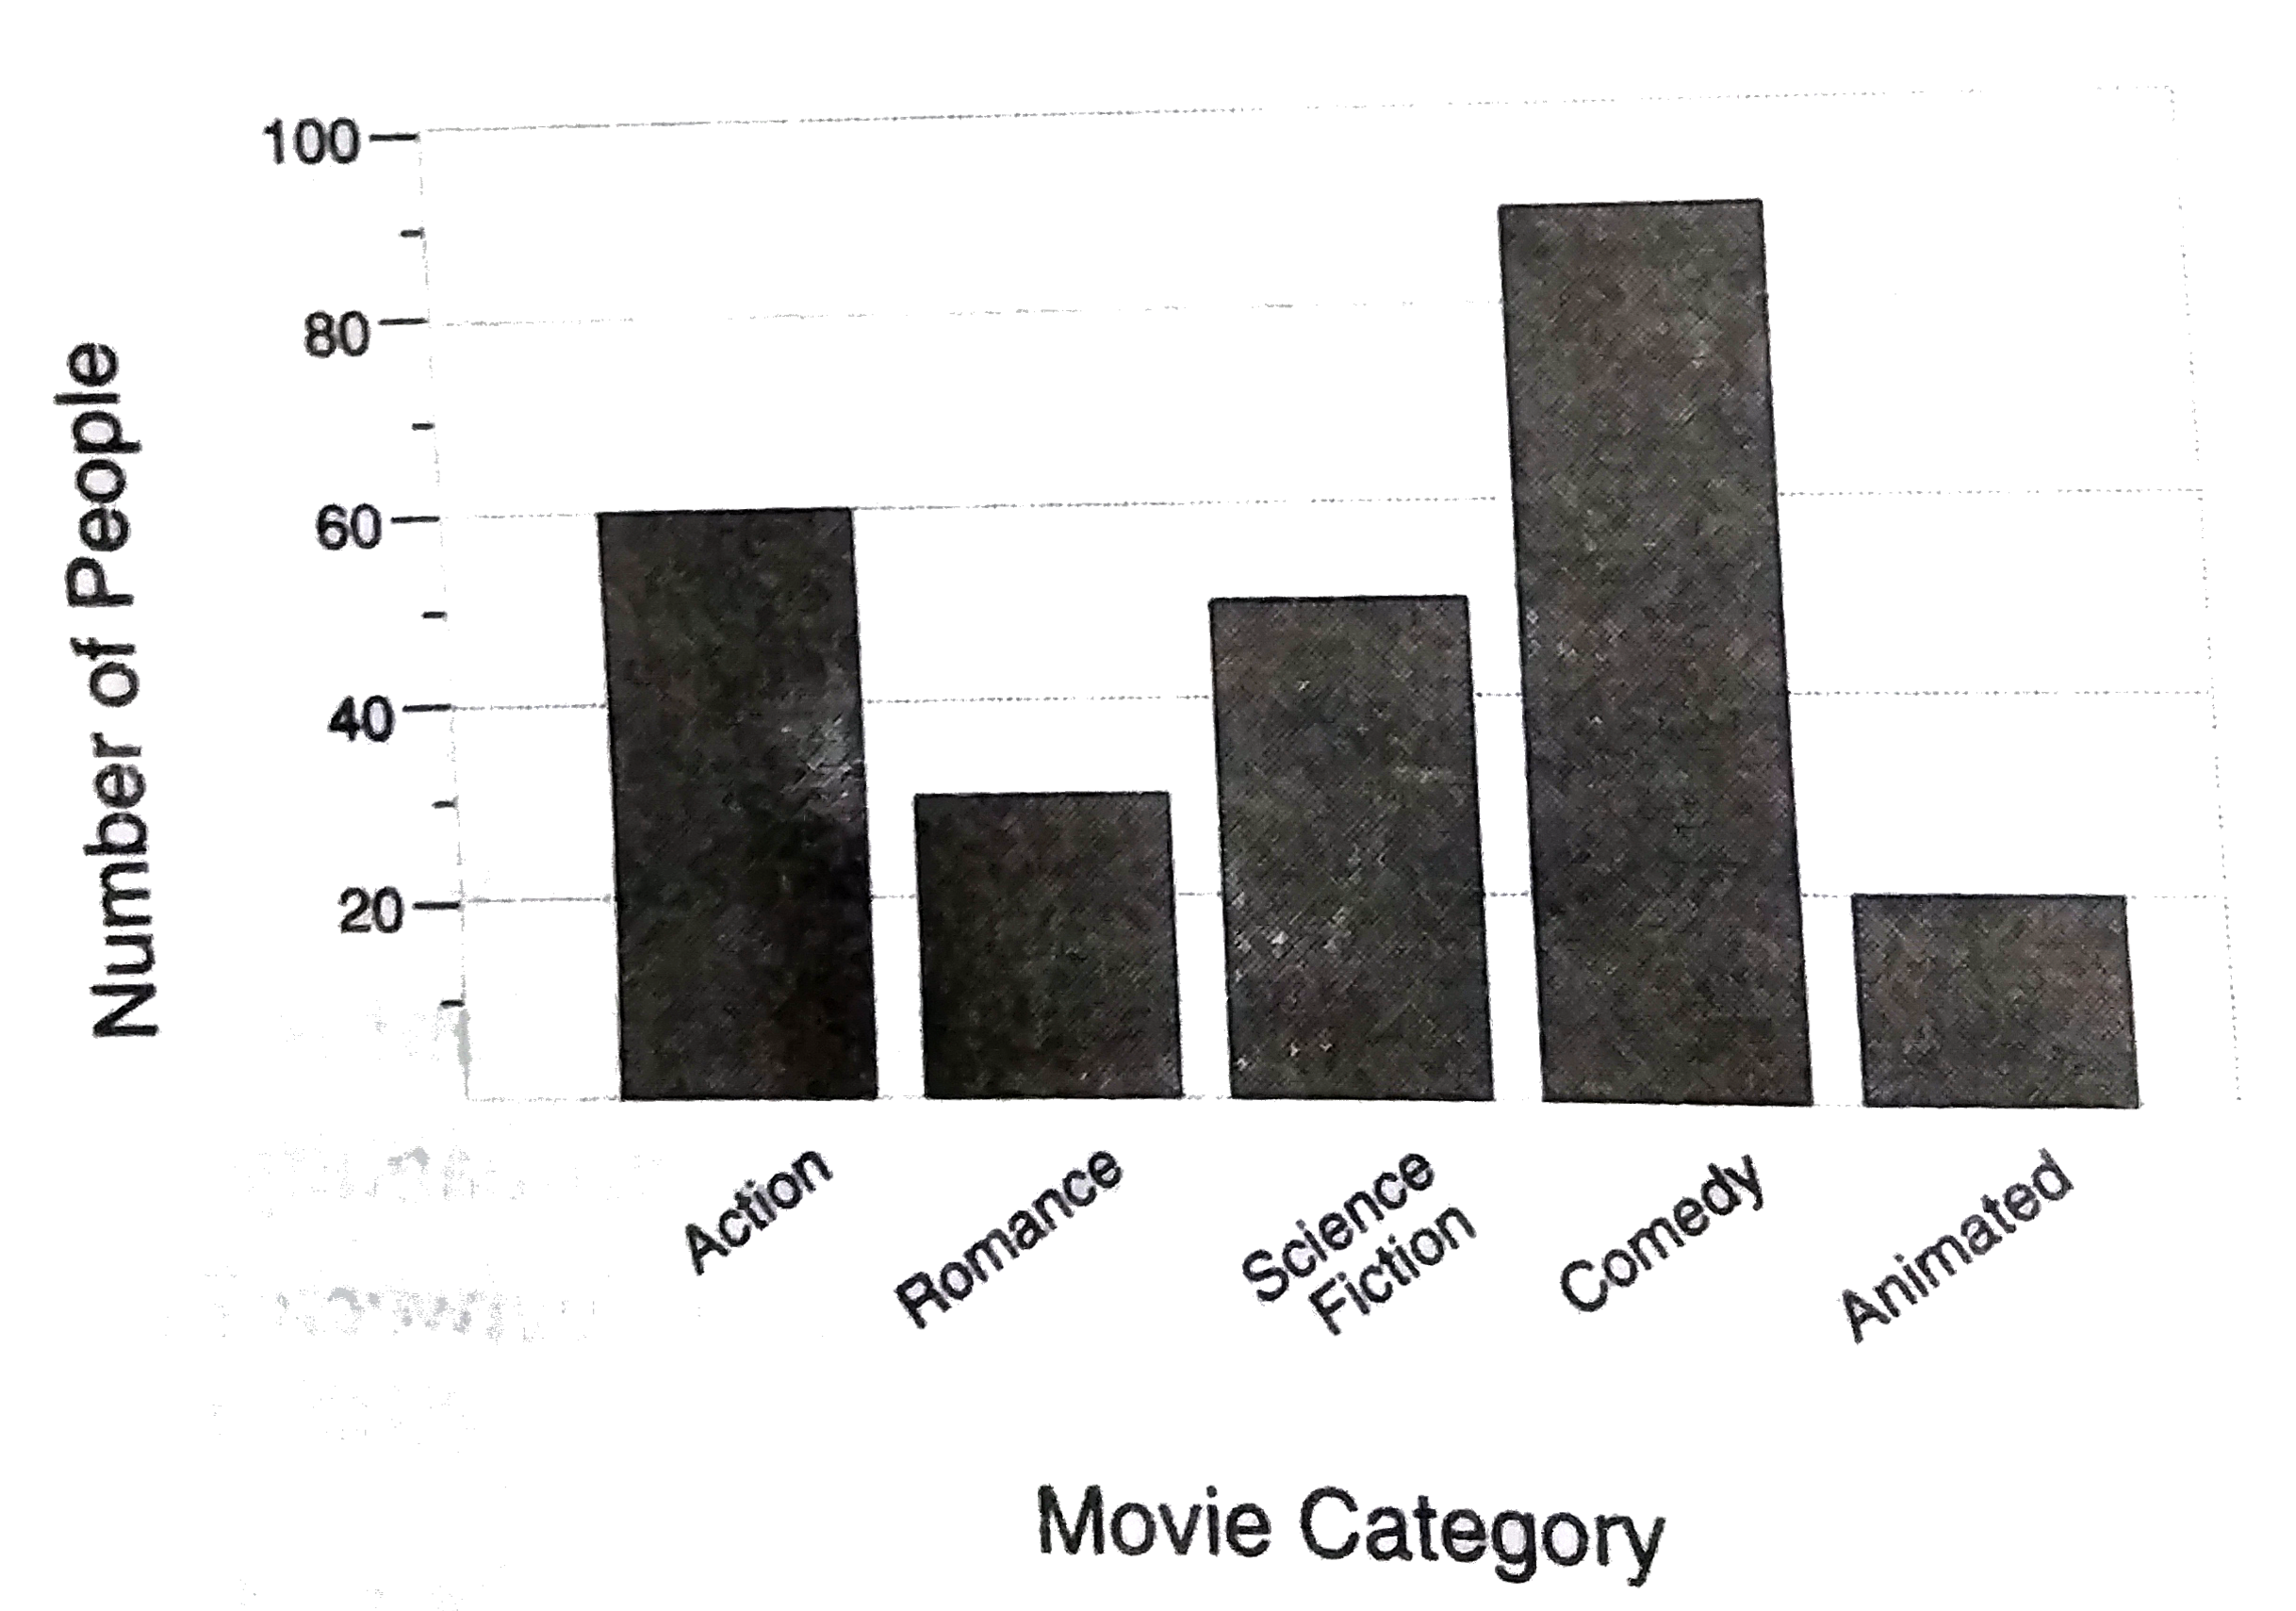
Question 1 and 2 refer to the graph above that summarizes a survey of a group of 250 people who were randomly selected when leaving a multiplex movie threater and asked what type of movie they had seen.
Q. If a total of 1,700 tickets were sold for the five types movies represented in the histogram, what is the best estimate for the number of tickets sold to the Ramance movie?
View SolutionSeeing the growing cases of diabetes and depression among young children, Mr. Chopra, the principal of one reputed school organized a seminar in which he invited parents and principals. They all resolved this issue by strictly banning junk food in schools and introducing healthy snacks and drinks like soup, lassi, milk, etc. in school canteens. They also decided to make compulsory half an hour of daily physical activities for the students in the morning assembly. After six months, Mr. Chopra conducted the health survey in most of the schools and discovered a tremendous improvement in the health of the students.
After reading the above passage, answer the following questions :
(i) What are the values (at least two) displayed by Mr. Chopra ?
(ii) As a student, how can you spread awareness about this issue ?
(iii) Why should antidepressant drugs not be taken without consulting a doctor ?
(iv) Give two examples of artificial sweeteners.
View SolutionA group of people were surveyed one of the choose one of the tow TV shows they preferred more : Sherlock Holmes and Friends . Of the total 30 people who put forward their choice , 18 chose Sherlck Holmes and 20 chose Friends.Each preson had to choose one of the shows mentioned above . Choose the correct statements (s) :
I. 8 people liked both shows.
II. 22 people perferred one show over the other .
III. 12 people liked only one of the two shows.
View SolutionEarthquaks in 2010, a devastating earthquake in haiti left over 100,000 people dead and thousands more injured. Hundreds of thousands of homes and businesses were destroyed in a matter of minutes. Several factors contributed to the loss of life and property in haiti, including socioeconomics and the magnitude of the quake. but what even causes an earthquake and what makes it so severe? Think about sitting still at your desk. Even if you aren't actively moving, your body is still technically in motion. This is due to plate tectonics and the constant shift of those plates on the surface of the earth. When tension builds up between these plates, they sometimes fracture and fault. this fracturing and faulting is what causes an earthquake. specifically, the rocks have a tremendous amount of potential energy built up between them as they press on each other. When these rocks break or "fault." it causes a seismic wave that makes the "ground shake" characteristic of an earthquake. people can sometimes feel earthquakes, but other times they're so small that only specialized machines detect them. These machines are called "seismographs." Earthquakes are measured on the richter scale, which is named for its inventor charles francis richter. The richter scale goes from 0 to 10 plus, with lower numbers representing smaller quakes, and higher numbers representing larger quakes. people rarely feen an earthquake with a magnitude of 2 or lower. These are the types that need to be picked up by a seismograph or they will go largely unnoticed. An earthquake with a magnitude of 3.0-3.9 is called a "minor earthquake." these can usually be felt by most people, but very rarely cause any damage. often times people end up attributing these small quakes to other causes like large trucks passing or large public transit vehicles. Earthquakes on the higher end of this range may cause slight shaking of household objects. once an earthquake reaches the range of 4.0-4.9, it is almost always felt by the majority of people. These "light earthquakes" will cause marginally more severe shaking and may knock objects off shelves. These quakes are still highly unlikely to cause any damage, other than to knocked over tchotchkes. an earthquake with a magnitude of 5.0 or higher will definitely be felt by people, and at this level, there will start to be damage to buildings. "moderate earthquakes." those with a magnitude of 5.0-5.9, rarely cause damage to well-constructed buildings, but sometimes older ones will experience cracked foundations, electrical trouble and sinking. In a "strong earthquake," a quake with a magnitude of 6.0-6.9, damage will be seen in most buildings unless they are built ot be "earthquake resistant." the damage seen in these buildings will be similar to those done by moderate quakes except it will be more severe and happen to more buildings. Typically, there will not be complete collapse of buildings until the level of a "major earthquake." These earthquakes with a magnitude of 7.0-7.9 can be felt many miles from the epicenter of the earthquake and can cause thousands of dollar's worth of damage. "Great earthquakes" are those with a richter level of 8.0 or higher. Major damage will occur even to earthquake resestant buildings at 9.0 or higher, there will be permanent changes to the ground geography. There will also be near to total destruction of most buildings in the area. The earthquake in the haiti had a magnitude of 7.0 however, the damage was more severe than one would expect due to the types of buildings common in haiti. To make buildings "earthquake resistant," as mentioned above, is much more expensive than building typical structures. This is an unimaginable luxury to many haitians who live on less than $2 a day. Additionally, the lack of infrastructure led many buildings to be in violation of "codes" meant to keep people safe in times of disaster.
As used in line 24, "slight" most nearly means
View SolutionEarthquaks in 2010, a devastating earthquake in haiti left over 100,000 people dead and thousands more injured. Hundreds of thousands of homes and businesses were destroyed in a matter of minutes. Several factors contributed to the loss of life and property in haiti, including socioeconomics and the magnitude of the quake. but what even causes an earthquake and what makes it so severe? Think about sitting still at your desk. Even if you aren't actively moving, your body is still technically in motion. This is due to plate tectonics and the constant shift of those plates on the surface of the earth. When tension builds up between these plates, they sometimes fracture and fault. this fracturing and faulting is what causes an earthquake. specifically, the rocks have a tremendous amount of potential energy built up between them as they press on each other. When these rocks break or "fault." it causes a seismic wave that makes the "ground shake" characteristic of an earthquake. people can sometimes feel earthquakes, but other times they're so small that only specialized machines detect them. These machines are called "seismographs." Earthquakes are measured on the richter scale, which is named for its inventor charles francis richter. The richter scale goes from 0 to 10 plus, with lower numbers representing smaller quakes, and higher numbers representing larger quakes. people rarely feen an earthquake with a magnitude of 2 or lower. These are the types that need to be picked up by a seismograph or they will go largely unnoticed. An earthquake with a magnitude of 3.0-3.9 is called a "minor earthquake." these can usually be felt by most people, but very rarely cause any damage. often times people end up attributing these small quakes to other causes like large trucks passing or large public transit vehicles. Earthquakes on the higher end of this range may cause slight shaking of household objects. once an earthquake reaches the range of 4.0-4.9, it is almost always felt by the majority of people. These "light earthquakes" will cause marginally more severe shaking and may knock objects off shelves. These quakes are still highly unlikely to cause any damage, other than to knocked over tchotchkes. an earthquake with a magnitude of 5.0 or higher will definitely be felt by people, and at this level, there will start to be damage to buildings. "moderate earthquakes." those with a magnitude of 5.0-5.9, rarely cause damage to well-constructed buildings, but sometimes older ones will experience cracked foundations, electrical trouble and sinking. In a "strong earthquake," a quake with a magnitude of 6.0-6.9, damage will be seen in most buildings unless they are built ot be "earthquake resistant." the damage seen in these buildings will be similar to those done by moderate quakes except it will be more severe and happen to more buildings. Typically, there will not be complete collapse of buildings until the level of a "major earthquake." These earthquakes with a magnitude of 7.0-7.9 can be felt many miles from the epicenter of the earthquake and can cause thousands of dollar's worth of damage. "Great earthquakes" are those with a richter level of 8.0 or higher. Major damage will occur even to earthquake resestant buildings at 9.0 or higher, there will be permanent changes to the ground geography. There will also be near to total destruction of most buildings in the area. The earthquake in the haiti had a magnitude of 7.0 however, the damage was more severe than one would expect due to the types of buildings common in haiti. To make buildings "earthquake resistant," as mentioned above, is much more expensive than building typical structures. This is an unimaginable luxury to many haitians who live on less than $2 a day. Additionally, the lack of infrastructure led many buildings to be in violation of "codes" meant to keep people safe in times of disaster.
According to the chart, the greatest magnitude earthquake occurred in which country?
View Solution
