An insurance company selected 2000 drivers at random (i.e., without any preference of one driver over another) in a particular city to find a relationship between age and accidents . The data obtained are given in following table :
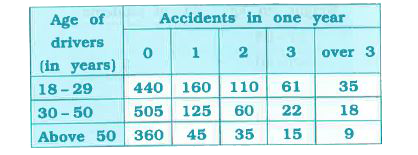
Find the probabilities of the following events for a driver chosen at random from the city.
being 18-29 years of age and having exactly 3 accidents in one year.
The correct Answer is:0.031
Step by step video & image solution for An insurance company selected 2000 drivers at random (i.e., without any preference of one driver over another) in a particular city to find a relationship between age and accidents . The data obtained are given in following table : Find the probabilities of the following events for a driver chosen at random from the city. being 18-29 years of age and having exactly 3 accidents in one year. by Maths experts to help you in doubts & scoring excellent marks in Class 9 exams.
Updated on:21/07/2023Topper's Solved these Questions
- PROBABILITY BOOK - NAVNEET PUBLICATION - MAHARASHTRA BOARDCHAPTER - PROBABILITY EXERCISE - Skill Testing Exercise
8 Videos
- PROBABILITY BOOK - NAVNEET PUBLICATION - MAHARASHTRA BOARDCHAPTER - PROBABILITY EXERCISE - EXERCISE 15.1
23 Videos
- LINE AND ANGLESBOOK - NAVNEET PUBLICATION - MAHARASHTRA BOARDCHAPTER - LINE AND ANGLESEXERCISE - Multiple Choice Questions MCQs)
10 Videos
- SURFACE AREAS AND VOLUMESBOOK - NAVNEET PUBLICATION - MAHARASHTRA BOARDCHAPTER - SURFACE AREAS AND VOLUMESEXERCISE - MULTIPLE CHOICE QUESTIONS
18 Videos
Similar Questions
An insurance company selected 2000 drivers at random (i.e., without any preference of one driver over another) in a particular city to find a relationship between age and accidents. The data obtained are given in the following table:

Find the probabilities of the following events for a driver chosen at random from the city:
(i) being 18-29 years of age and having exactly 3 accidents in one year.
(ii) being 30-50 years of age and having one or more accidents in a year.
(iii) having no accidents in one year
View SolutionAn insurance company selected 2000 drivers at random (i.e., without any preference of one driver over another) in a particular city to find a relationship between age and accidents . The data obtained are given in following table :
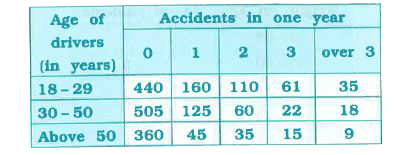
Find the probabilities of the following events for a driver chosen at random from the city.
having no accidents in one year
View SolutionAn insurance company selected 2000 drivers at random (i.e., without any preference of one driver over another) in a particular city to find a relationship between age and accidents . The data obtained are given in following table :
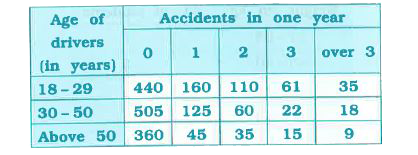
Find the probabilities of the following events for a driver chosen at random from the city.
being 30-50 years of age and having one or more accidents in a year.
View SolutionAn insurance company selected 2000 drivers at random in particular city to find a relationship between age and accidents . The data obtained are given in the following table .
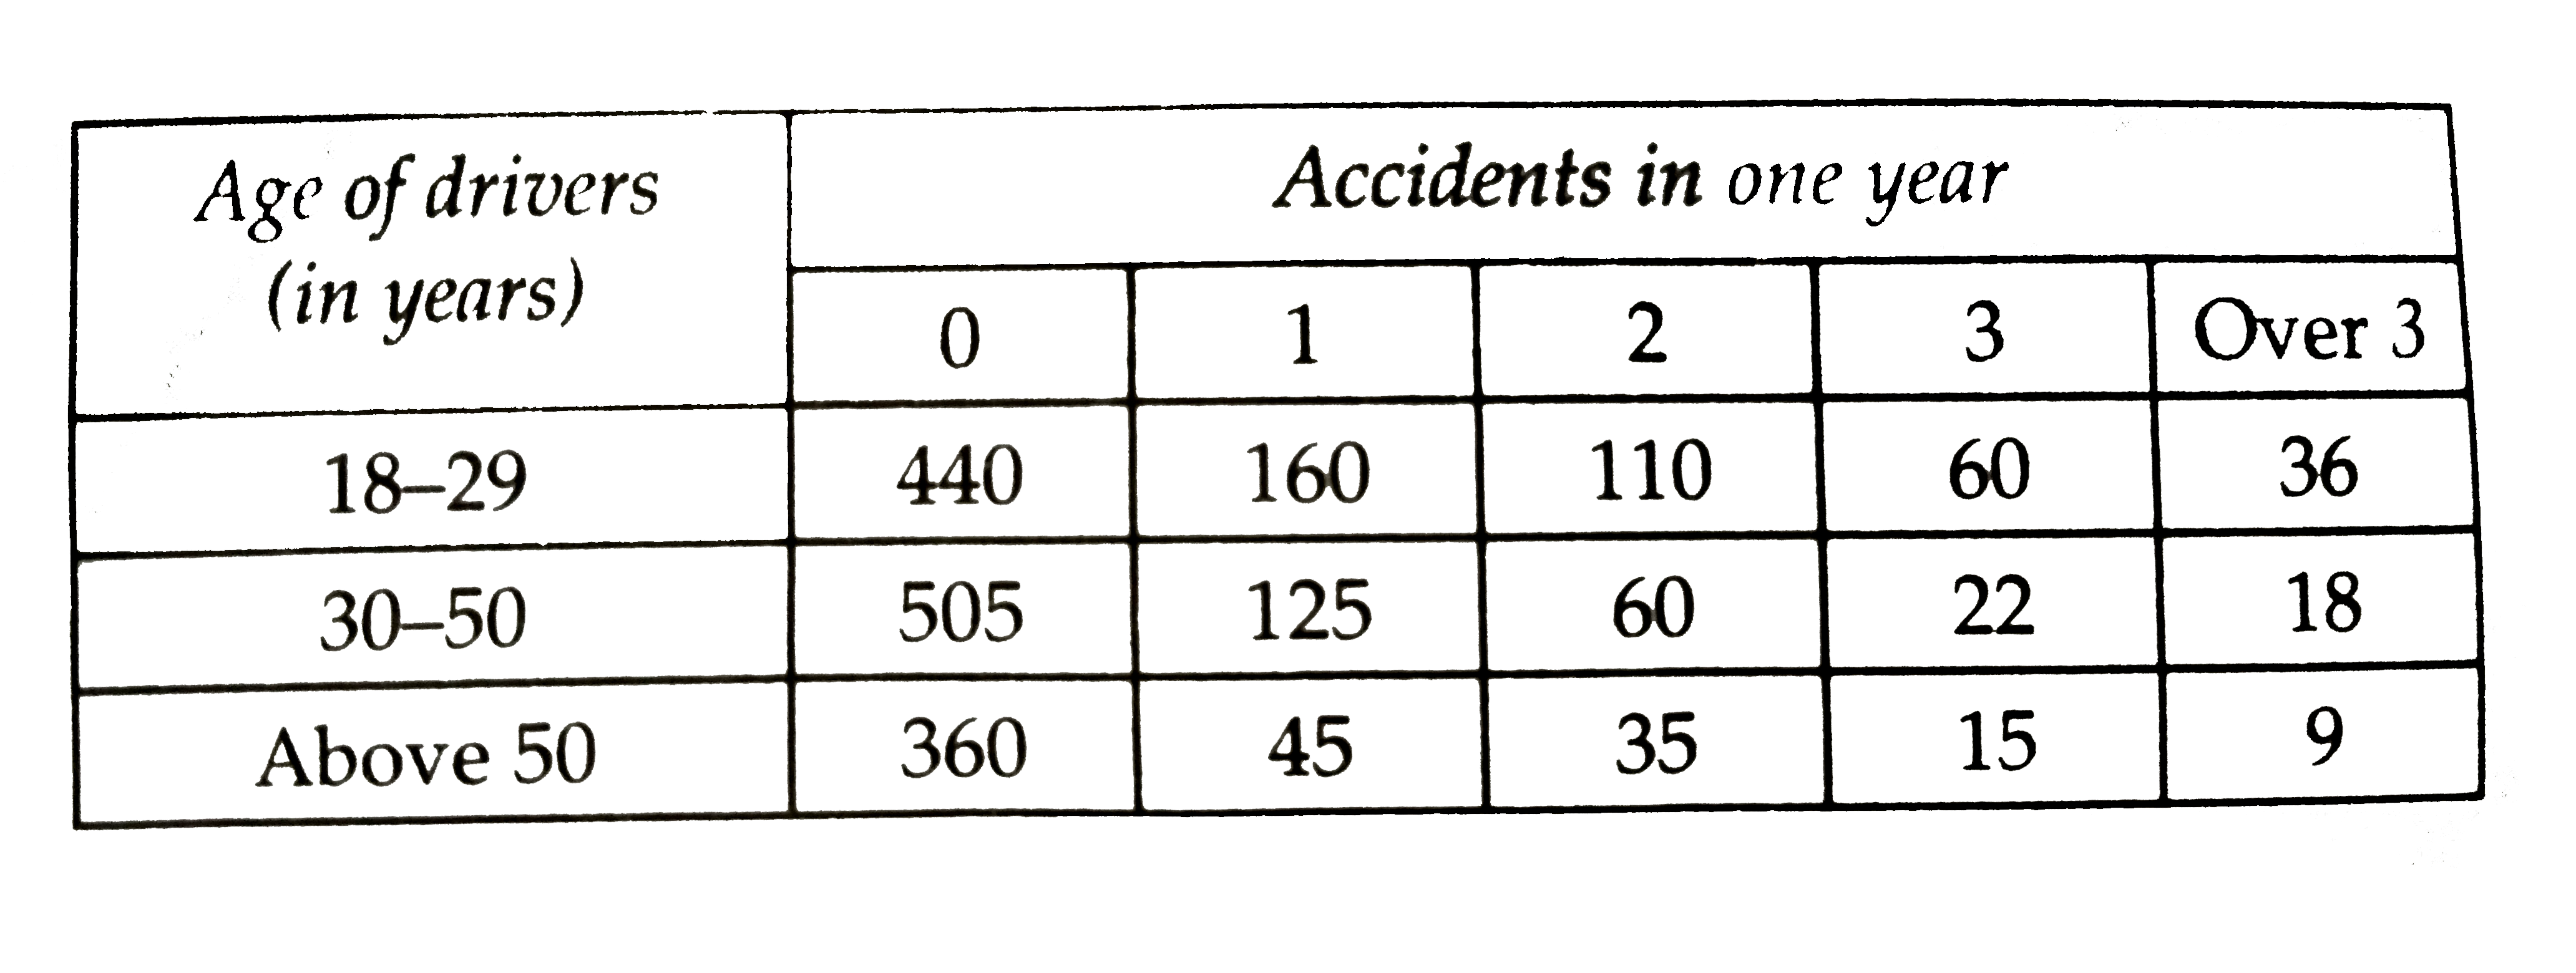
Find the probability of each of the following events for a driver chosen at random from the city :
(i) being 18−29 years of age and having exactly 3 accidents in one year .
(ii) being 30−50 years of age and having one or more accidents in one year
(iii) having no accident in one year .
View SolutionAn insurance company selected 2000 drivers at random in a particular city to find a relationship between age and accidents. The obtained are given in the following table: Age of Drivers (in years) Accidents in one year 0 1 2 3 over 3 18-29 30-50 above 50 440 505 360 160 125 45 110 60 35 61 22 15 35 18 9 Find the probability of the following events for a driver chosen at random from the life city: being 18-29 years of age and having exactly 3 accidents in one year. being 30-50 years of age and having one or more accidents in a year. having no accidents in one year.
View SolutionA selection committee of school selected 2000 girls for scholarship of different age. The data obtained are given in the following table:
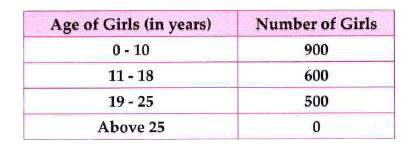
Find the probabilities of the girls selected for scholarship in following age group.
11 - 18
View SolutionA selection committee of school selected 2000 girls for scholarship of different age. The data obtained are given in the following table:
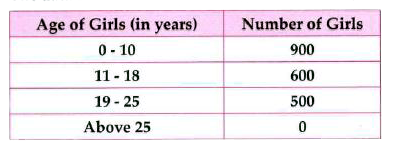
Find the probabilities of the girls selected for scholarship in following age group.
0 - 18
View Solution
A driver is chosen at random. The probability that he took 110 minutes or more is
View Solution
A driver is chosen at random. The probability that he took 90 minutes or less is
View SolutionThe driver tried his best (a)/ to avert the accident by bringing the car (b)/ to a suddenly stop.(c)/ No error (d)
View Solution
