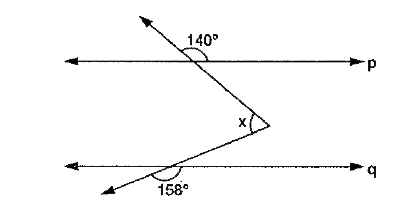
Assume p∣∣q in the figure shown .then 'x' equaals
18∘
22∘
62∘
cannot be determined
The correct Answer is:C
Step by step video, text & image solution for Assume p||q in the figure shown .then 'x' equaals by Maths experts to help you in doubts & scoring excellent marks in Class 7 exams.
Topper's Solved these Questions
- BOOK - S CHAND IIT JEE FOUNDATIONCHAPTER - LINES AND ANGLES EXERCISE - SELF ASSESSMENT SHEET10videos
LINES AND ANGLES
- BOOK - S CHAND IIT JEE FOUNDATIONCHAPTER - LINES AND ANGLES EXERCISE - SELF ASSESSMENT SHEET10videos
LINES AND ANGLES
- BOOK - S CHAND IIT JEE FOUNDATIONCHAPTER - LINEAR EQUATIONS IN ONE VARIABLEEXERCISE - Unit Test -220videos
LINEAR EQUATIONS IN ONE VARIABLE
- BOOK - S CHAND IIT JEE FOUNDATIONCHAPTER - NUMBERSEXERCISE - SELF ASSESSMENT SHEET-110videos
NUMBERS
Similar Questions
Knowledge Check
- Question 1 - Select One
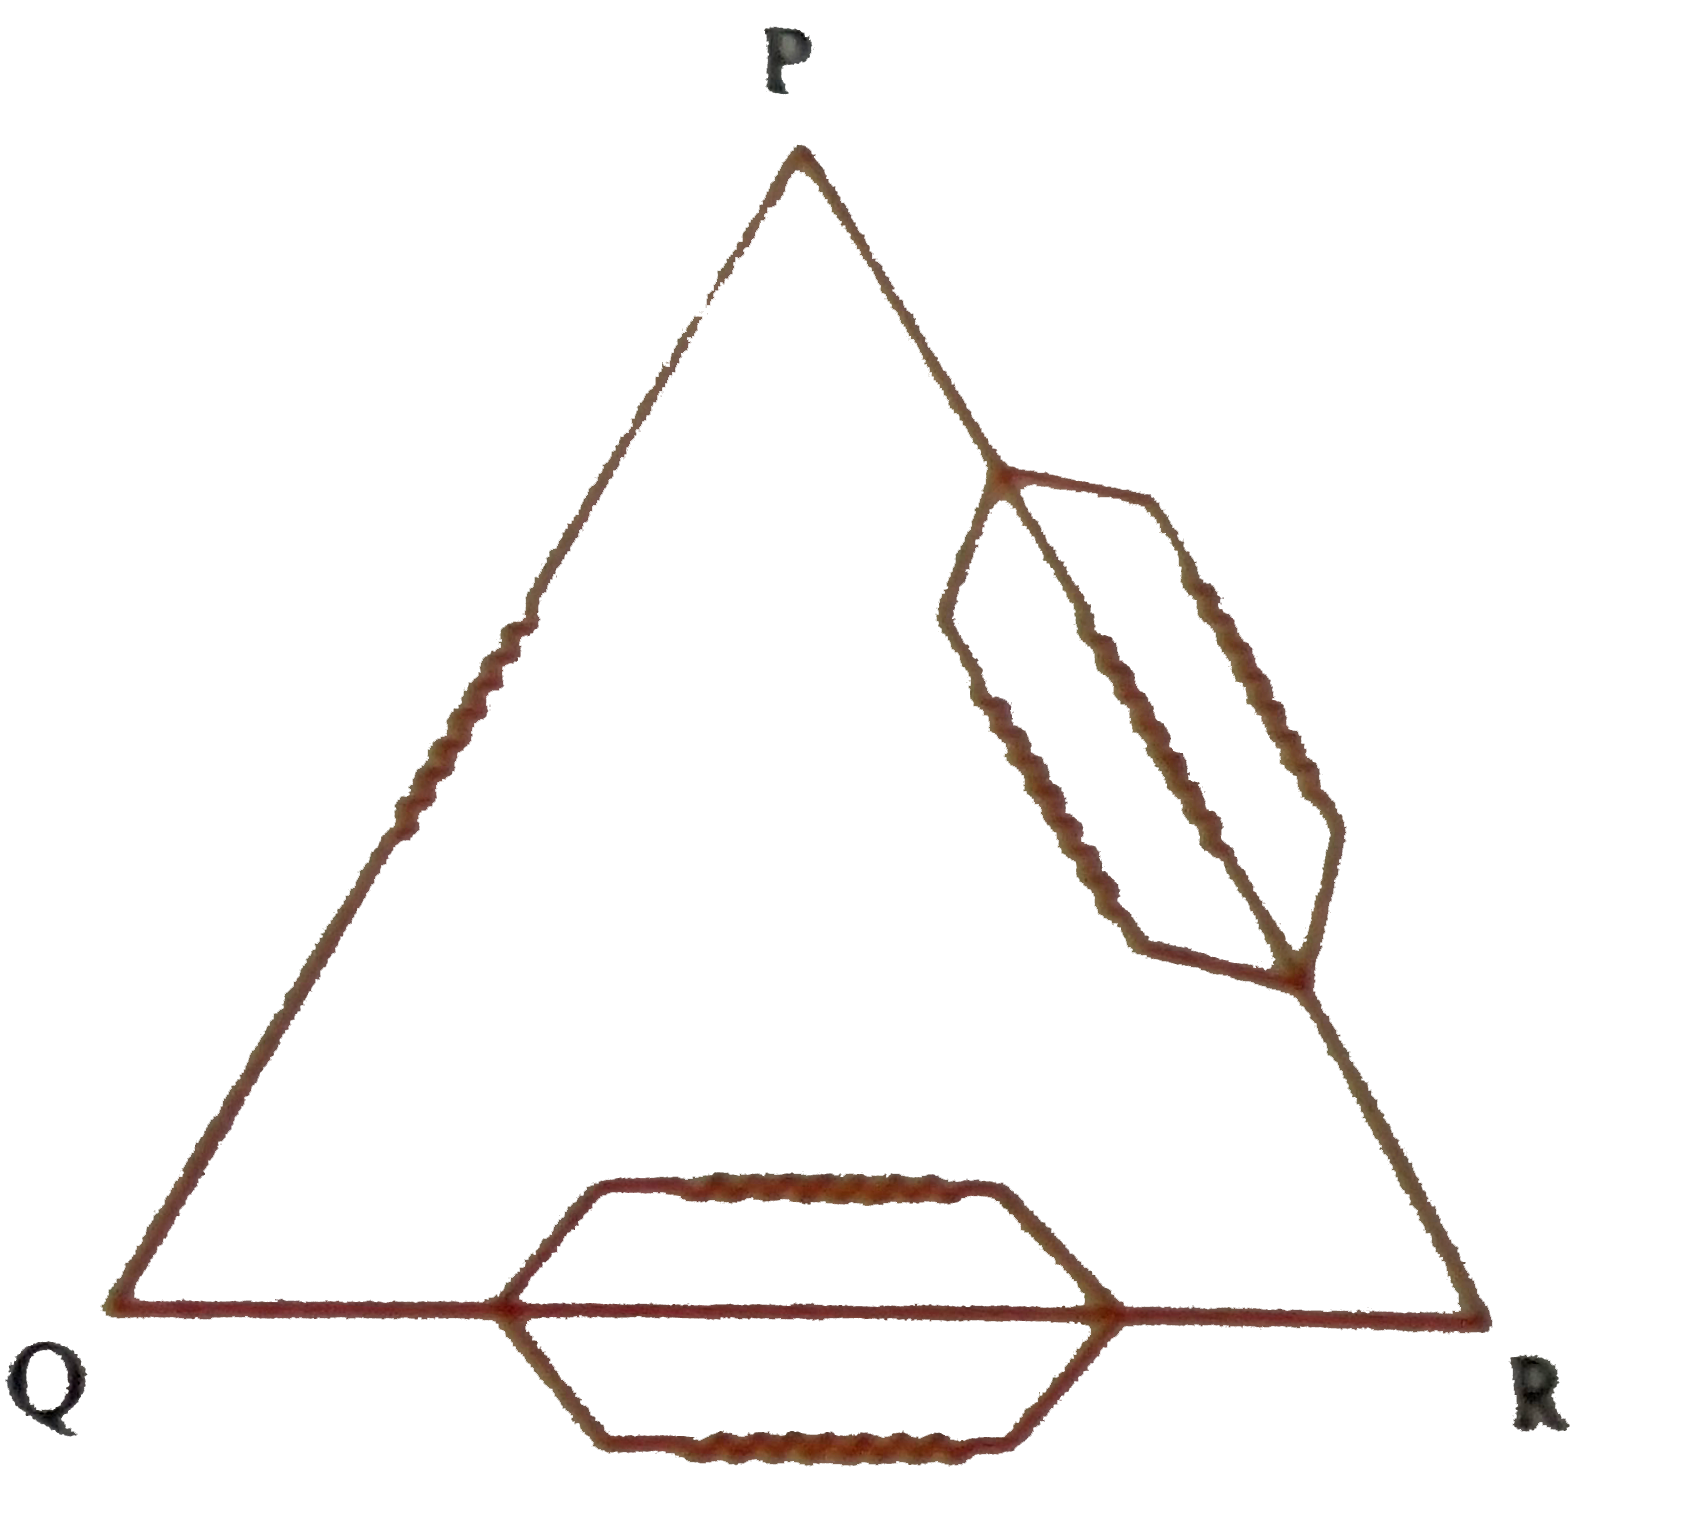
Six equal resistances are connected between points P, Q and R as shown in the figure. Then the net resistance will be maximum betweenAP and QBQ and RCP and RDany two points - Question 2 - Select One
A body of mass 60 kg suspended by means of three strings, P, Q and R as shown in the figure is in equlibrium. The tension in the string P is
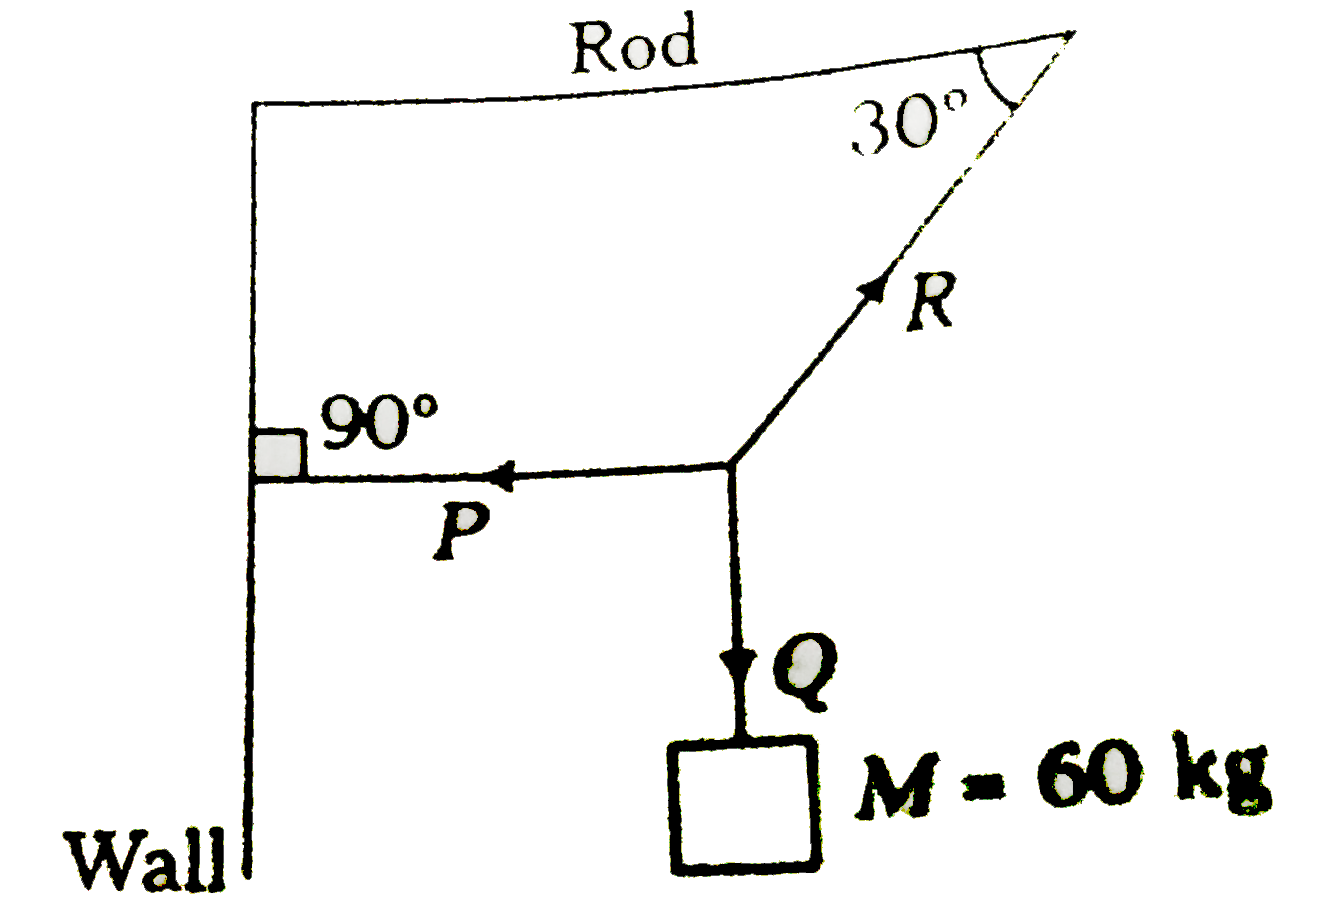 A130.9 kgfB60 kgfC50 kgfD103.9 kgf
 - Question 3 - Select One
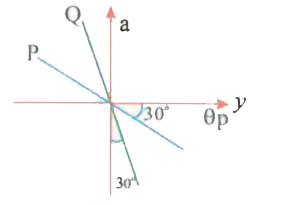
Two particles P and Q are moving as shown in the figure. At this moment of time the angular speed of P w.r.t. Q is
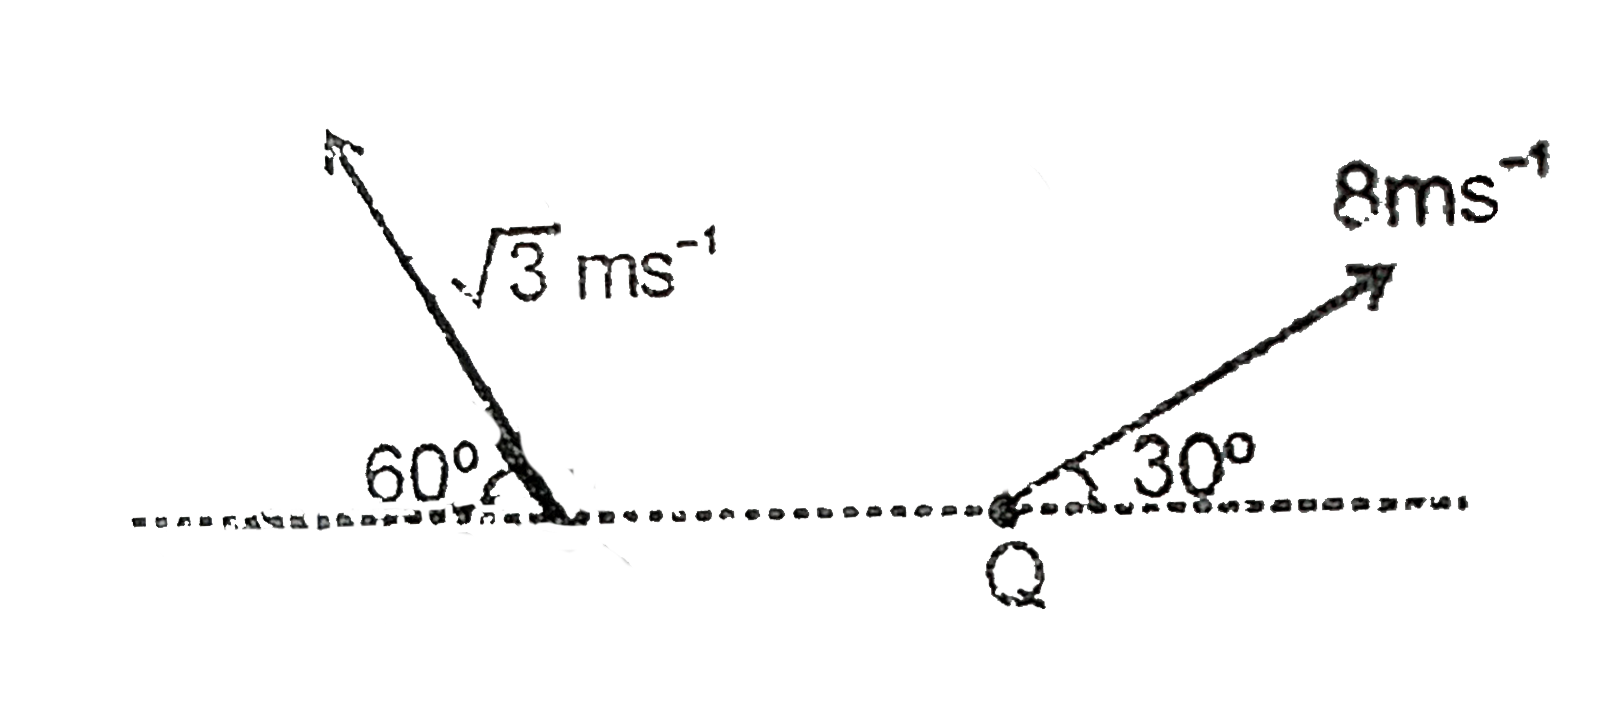 A5 rads−1B4 rads−1C2 rads−1D1 rads−1
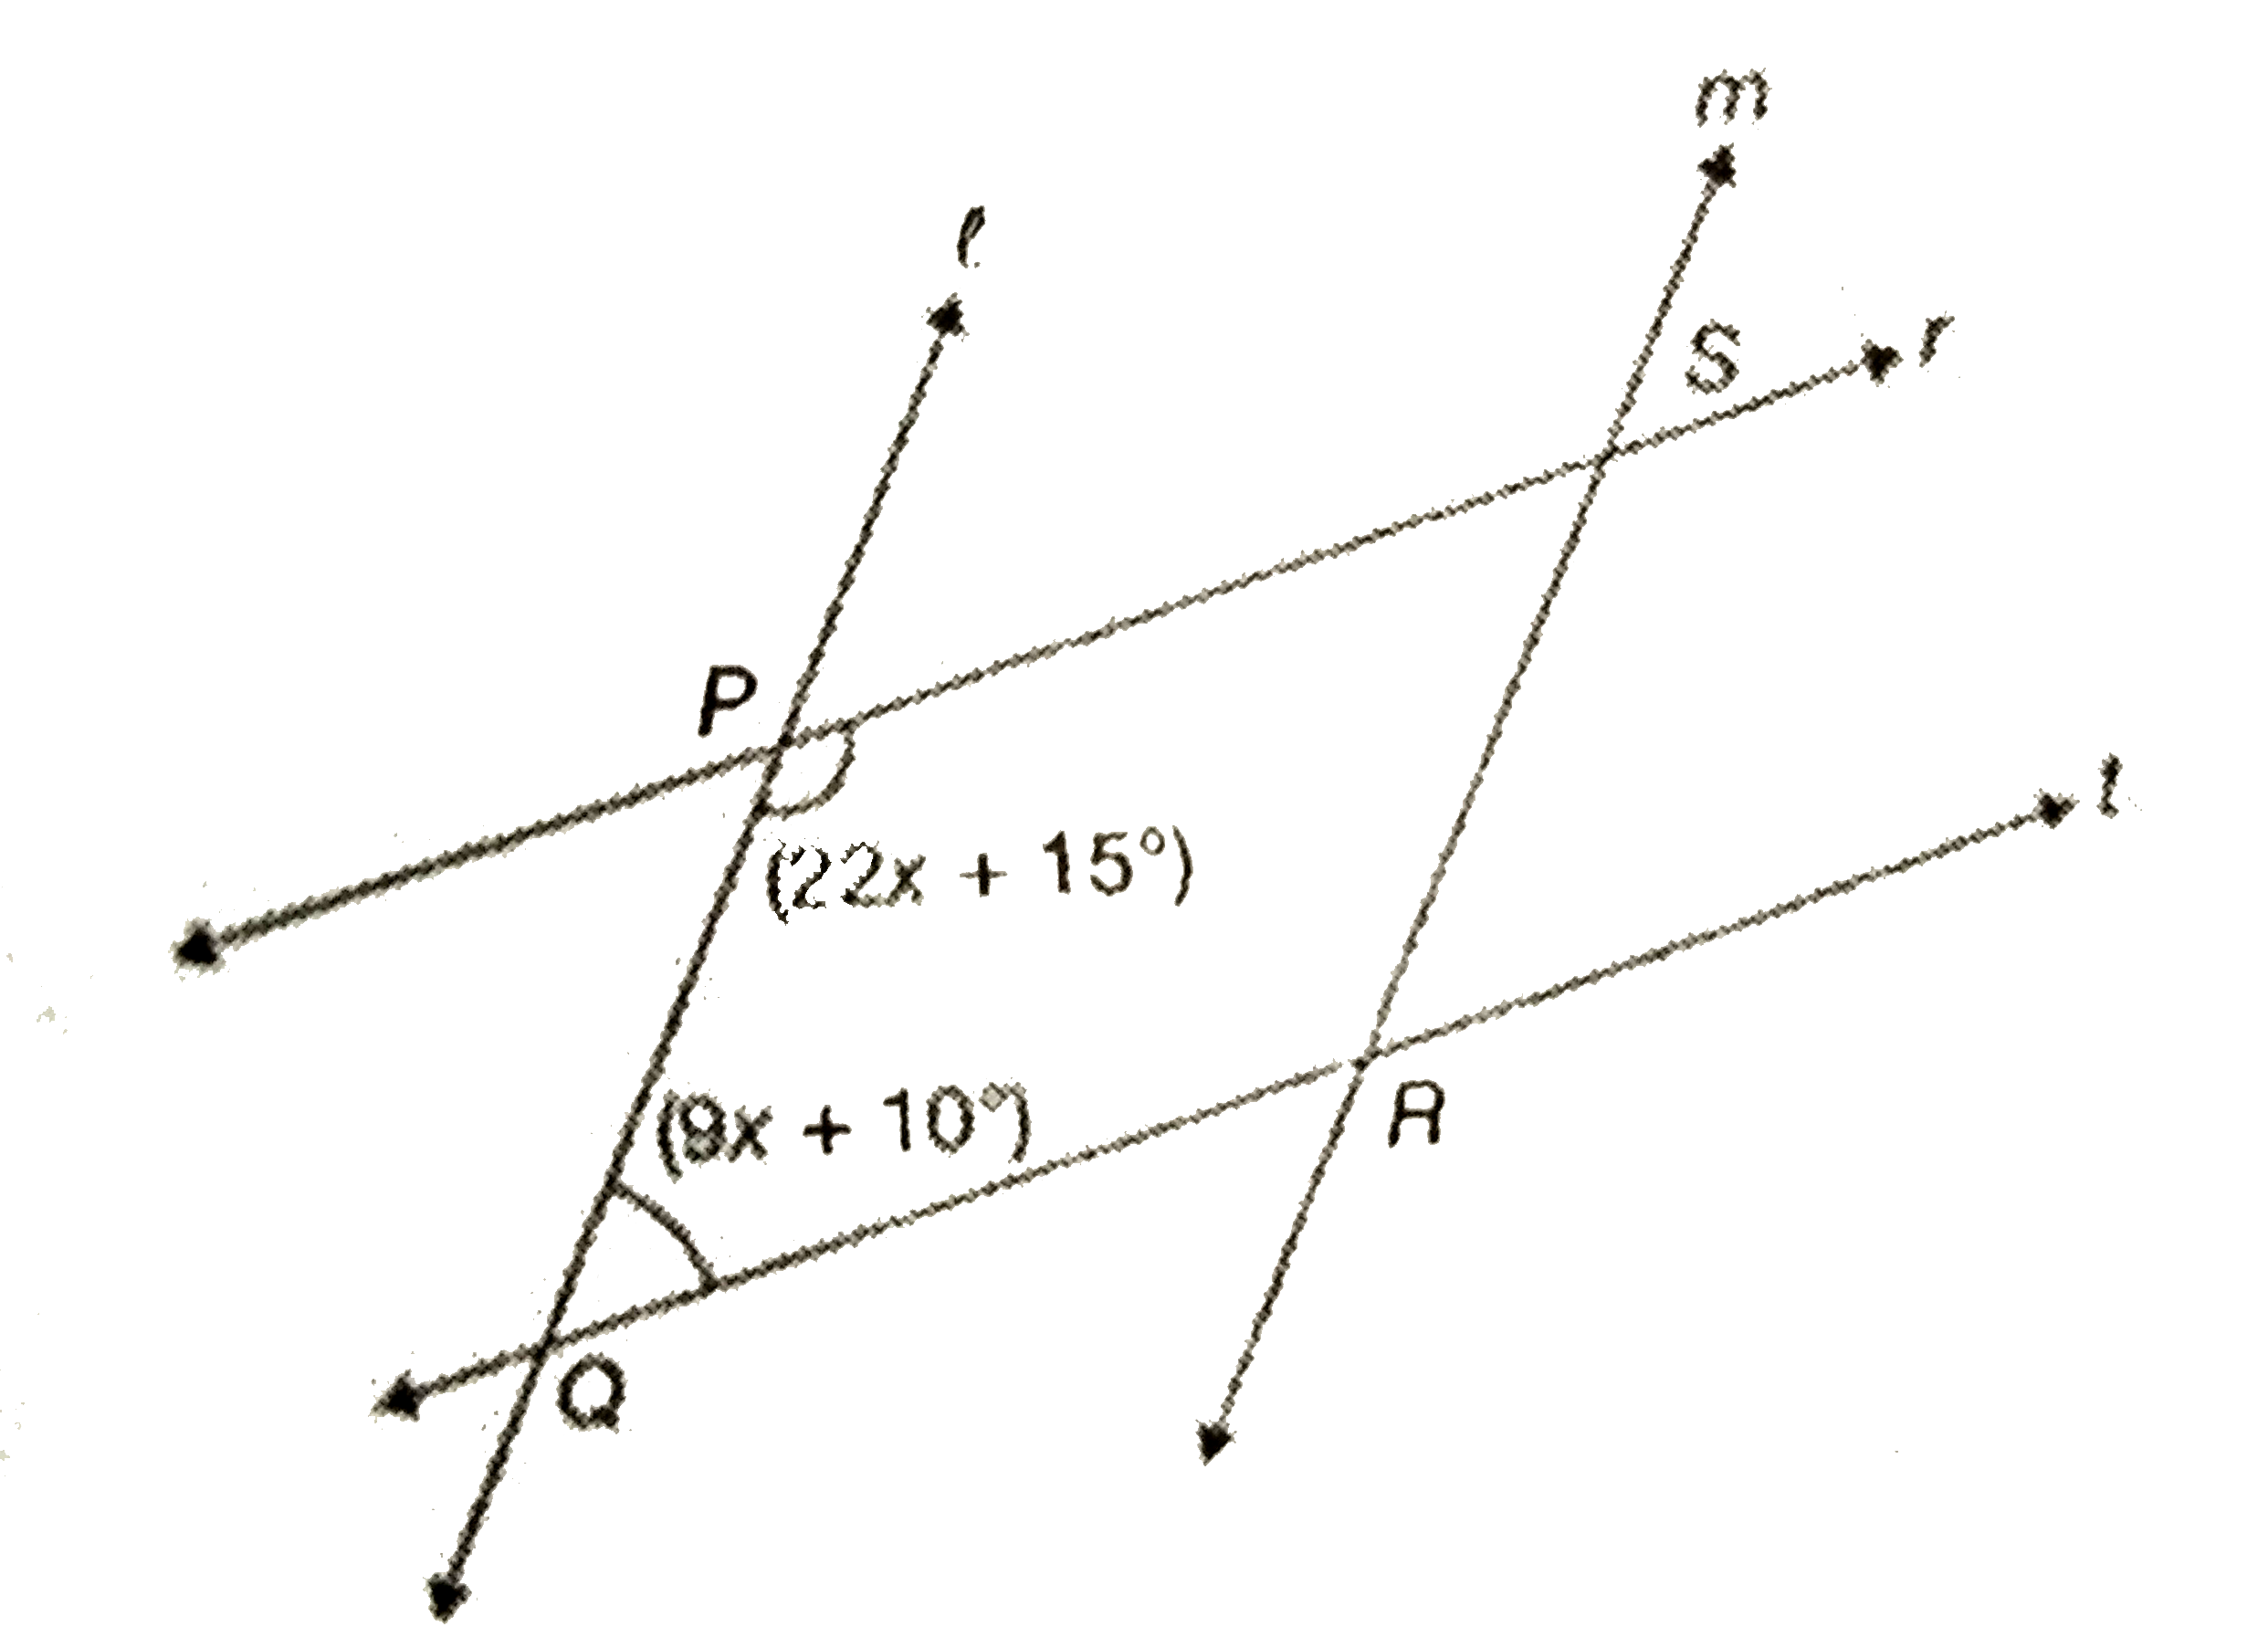
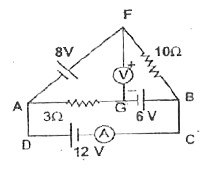
In the figure, l || mandr || t. They intersect at P, Q, R and S as shown in the figure. Find the angles of ∠SPQand∠PSR.View SolutionFind the reading of ammeter A and voltmeter V shown in the figure assuming the instruments to be ideal
 View Solution
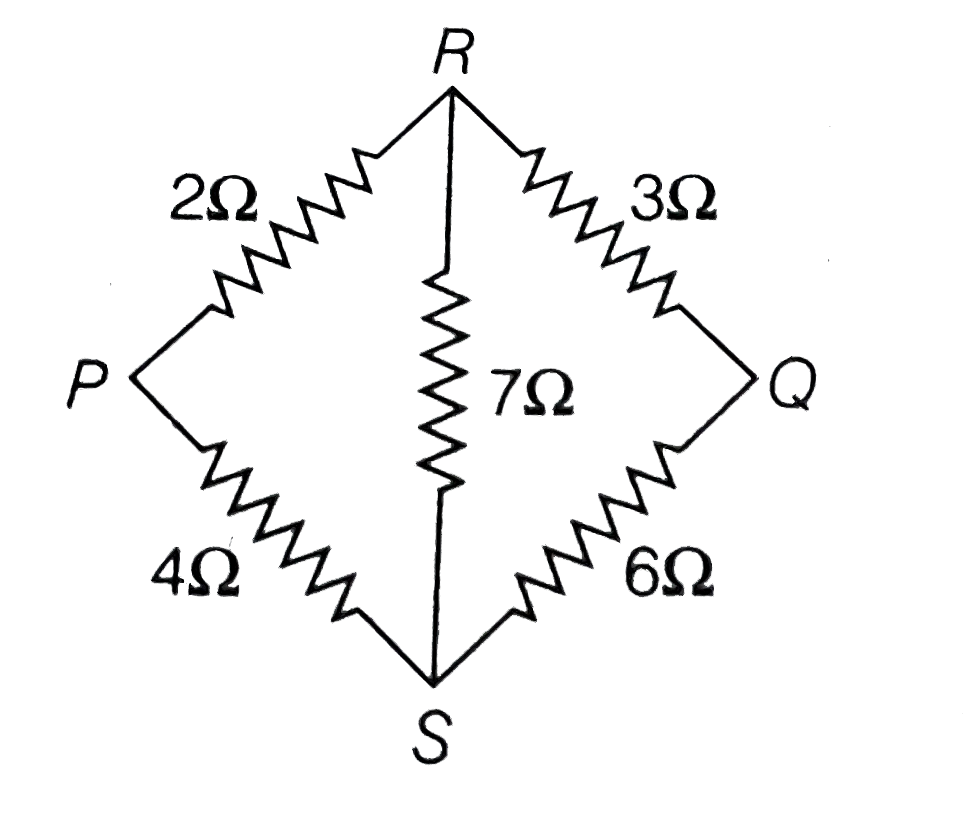
Five resistance are connected as shown in the figure . The equivalent resistance between P and Q will be
 View Solution
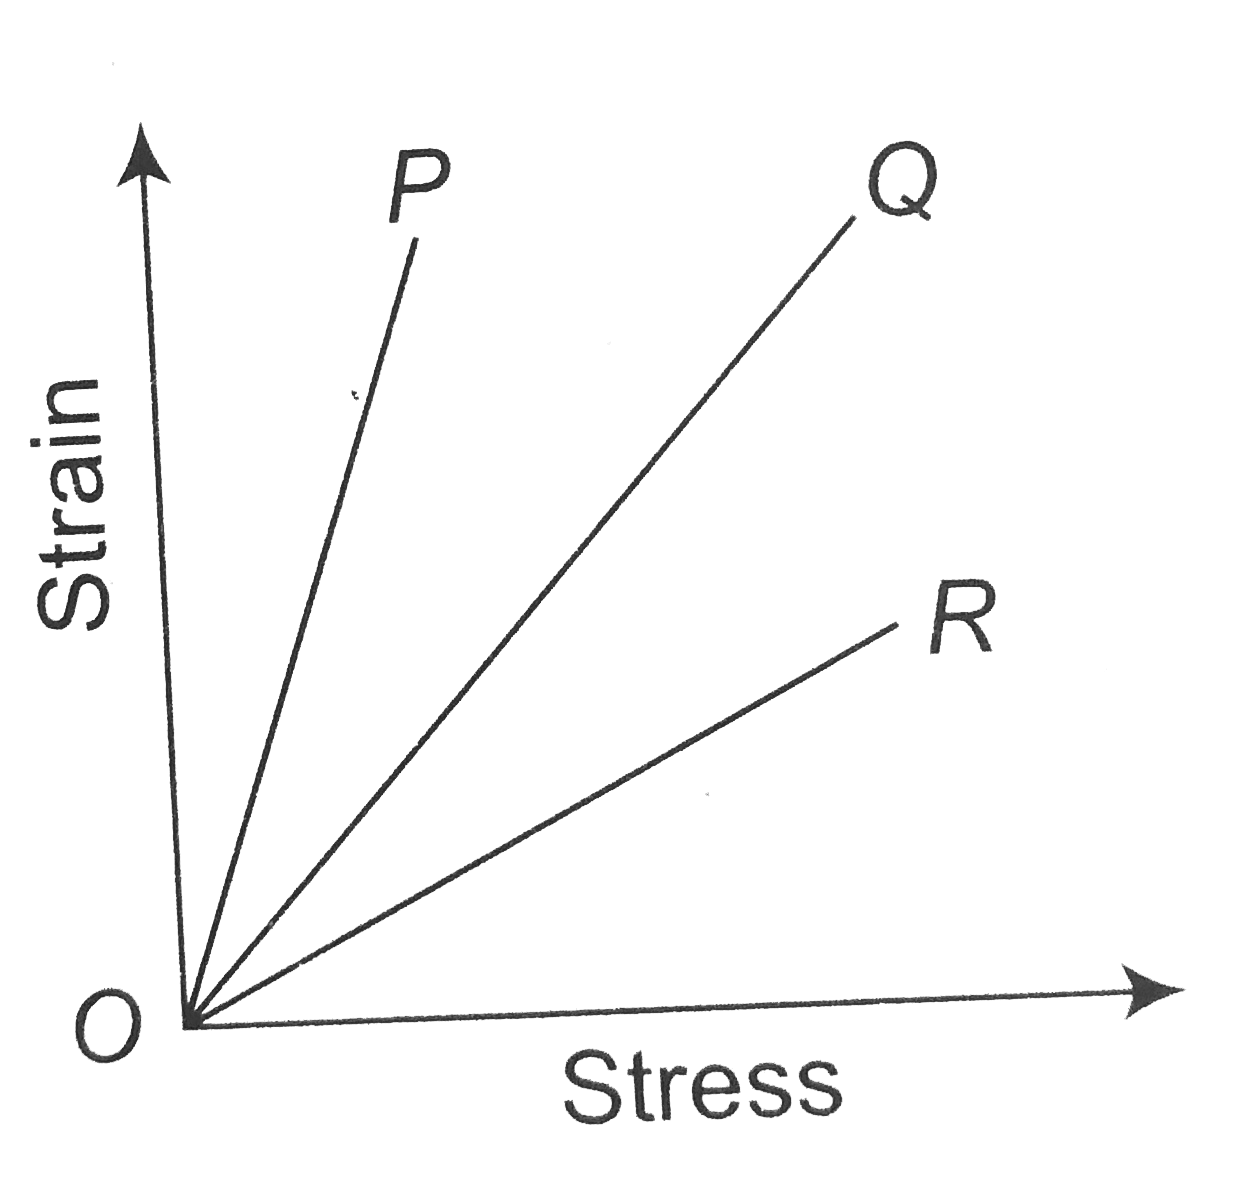
The strain stress curves of three wires of different materials are shown in the figure. P, Q and R are the elastic limits of the wires. The figure shown thatView SolutionThe acceleration-displacement graph of two particles P and Q exeucting SHM are represented as shown in the figure. The ratio of time periods of P, q respectively is
 View Solution

