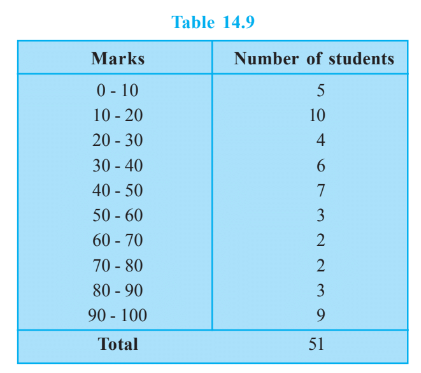
Consider the marks, out of 100, obtained by 51 students of a class in a test, given in Table 14.9

we draw a frequency polygon by drawing a histogram first
calculating points where frequency =0
difference :10-0=10
first point 0+102−10=−5
Last point 90+1002+10=95+10=105
so we plot the points (-5,0)&(105,0)
Similar Questions
Consider the marks, out of 100, obtained by 50 students of a class given in the table.

Draw a frequency polygon corresponding to this frequency distribution table using histogram.View SolutionThe table given below shows the marks obtained by 50 students of a class in a test with maximum 2. marks 100.

A student of the class is selected at random. Find the probability that the selected student gets
less than 15% marksView Solution
Knowledge Check
- Question 1 - Select One
The table given below shows the marks obtained by 80 students of a class in a test with maximum marks 100 .

A student of the class is selected at random .
Find the probability that he gets
(i) less than 15% marks ,
(ii) 60 or more marks and
(iii) less than 45 marks .A340, 14, 920B740, 34, 320C940, 34, 1120D1740, 14, 1720 - Question 2 - Select One
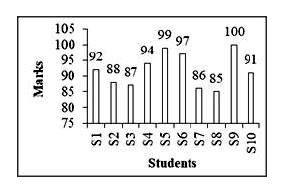
The Bar graph given below presents the marks (out of 100) obtained by 10 students in a subject.

What is the average of the marks obtained by all the students?AA)91.9BB)90.9CC)89.9DD)82.9 - Question 3 - Select One
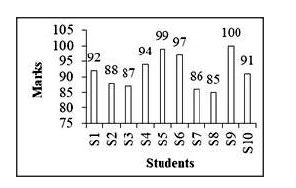
The Bar graph given below presents the marks (out of 100) obtained by 10 students in a subject.

The average of marks obtained by S3 and 55 is what percent less than the marks obtained by S9?A8%B10%C7%D9%
The table given below shows the marks obtained by 50 students of a class in a test with maximum marks 100.

A student of the class is selected at random. Find the probability that the selected student gets
60% or more marksView SolutionThe table given below shows the marks obtained by 50 students of a class in a test with maximum marks 100.

A student of the class is selected at random. Find the probability that the selected student gets
marks equal to or greater than 45% but less than 60%.View SolutionThe marks obtained by 60 students of a class in a methematics test are given

Represent the above data by means of a histogram.View SolutionThe following table shows the marks obtained by 100 students of a class in a school during a particular academic session. Find the modal marks.
 View Solution
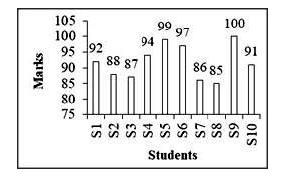
The Bar graph given below presents the marks (out of 100) obtained by 10 students in a subject.

The marks obtained by S5 is how much percent more than the average marks of the students (correct to two decimal)?View Solution

