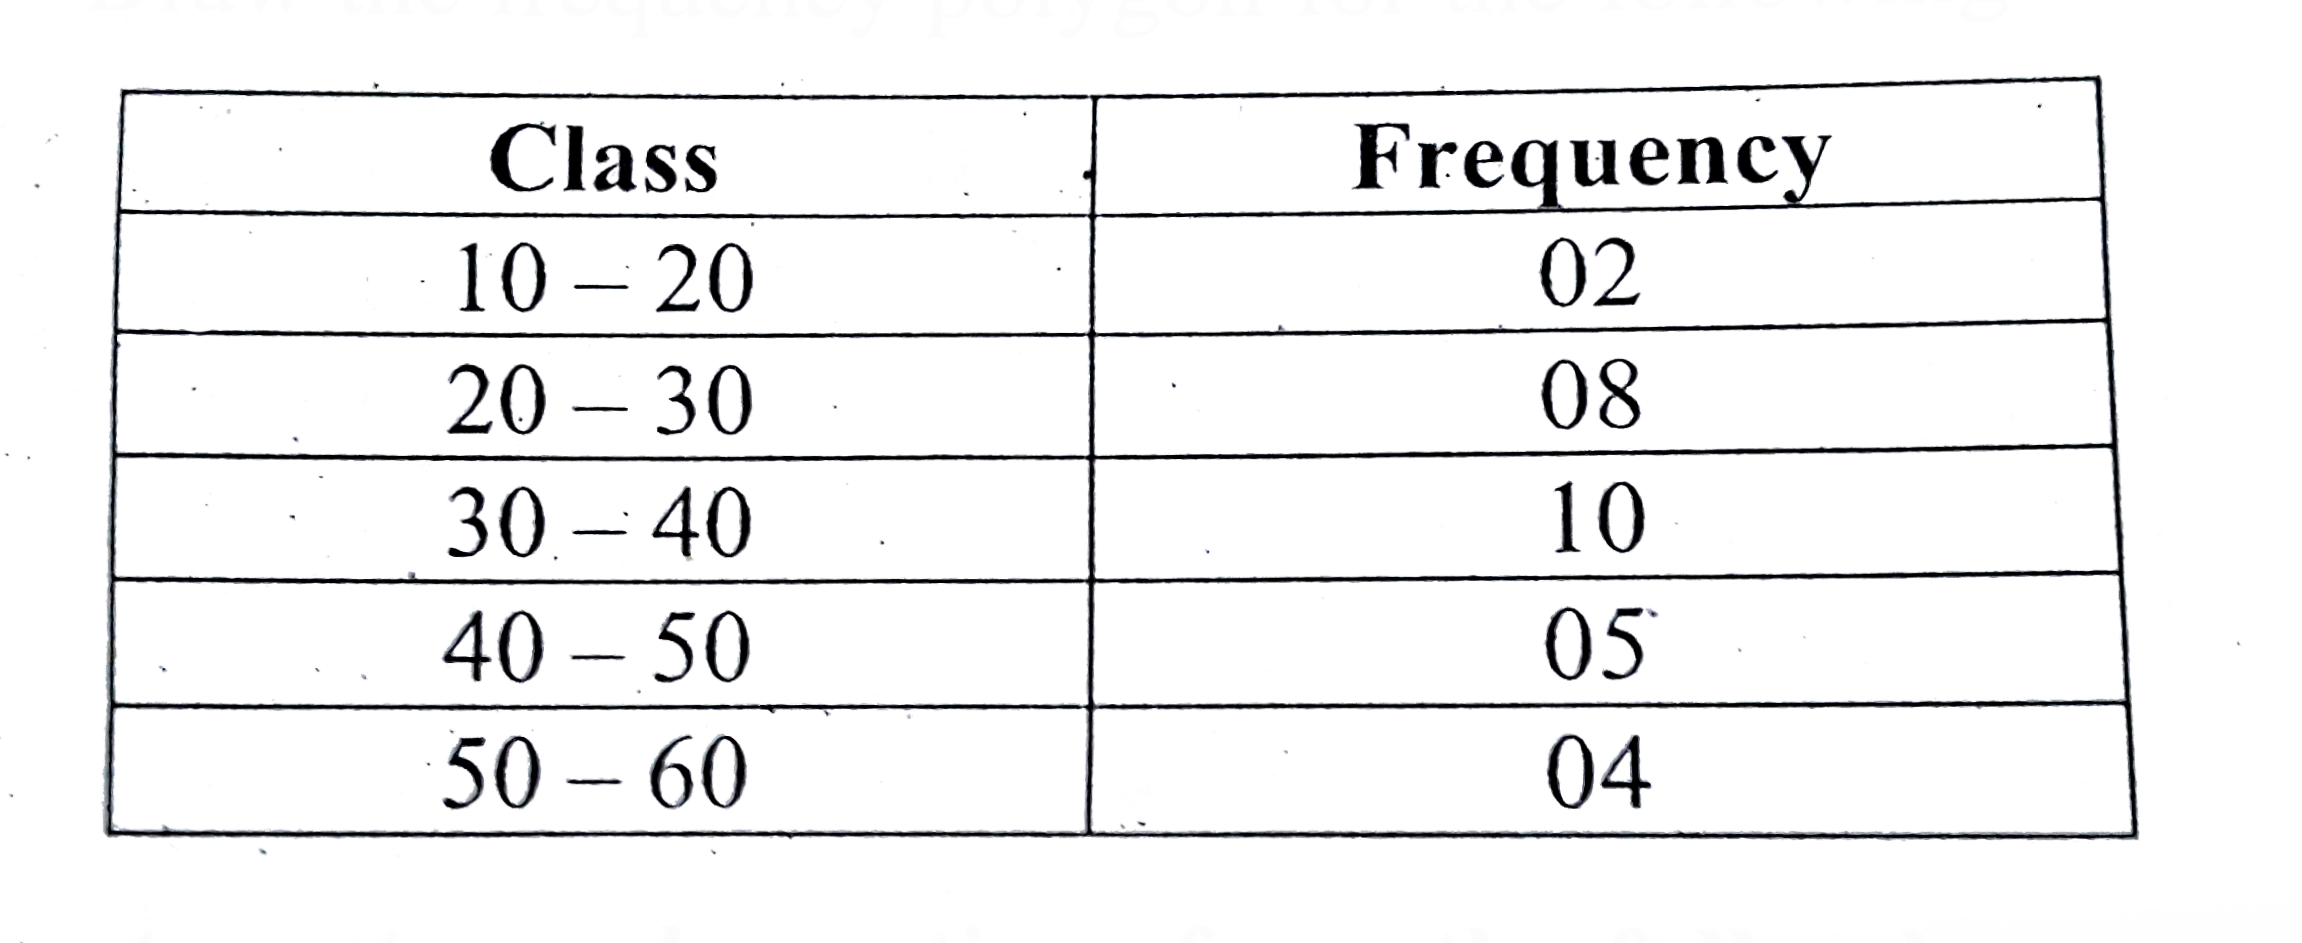
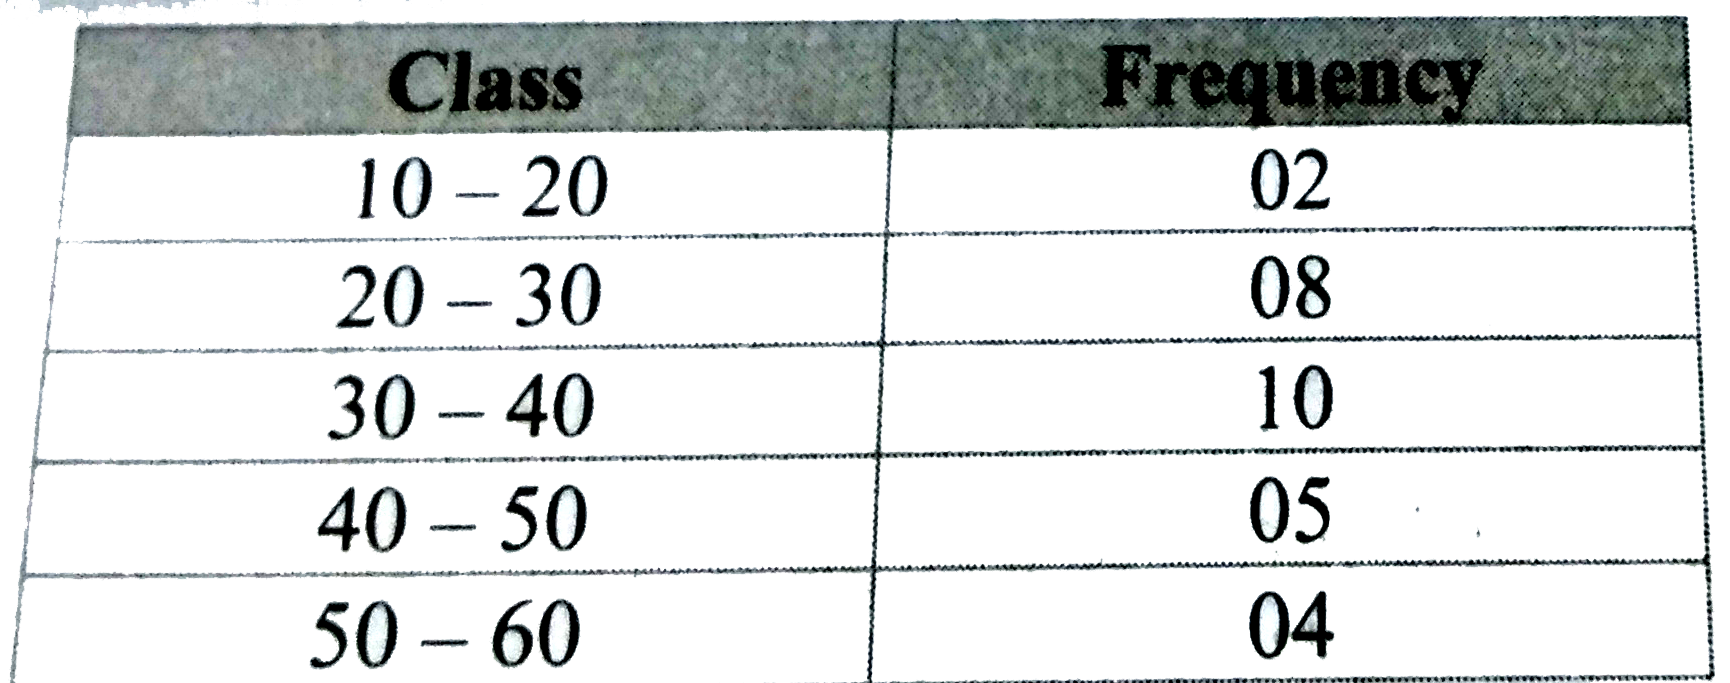
Consider the marks, out of 100, obtained by 50 students of a class given in the table.

Draw a frequency polygon corresponding to this frequency distribution table using histogram.
The correct Answer is:
Step by step video, text & image solution for Consider the marks, out of 100, obtained by 50 students of a class given in the table. Draw a frequency polygon corresponding to this frequency distribution table using histogram. by Maths experts to help you in doubts & scoring excellent marks in Class 9 exams.
Topper's Solved these Questions
- BOOK - MTG IIT JEE FOUNDATIONCHAPTER - STATISTICSEXERCISE - SOLVED EXAMPLES28videos
STATISTICS
- BOOK - MTG IIT JEE FOUNDATIONCHAPTER - STATISTICSEXERCISE - NCERT SECTION (Exercise 14.1)2videos
STATISTICS
- BOOK - MTG IIT JEE FOUNDATIONCHAPTER - QUADRILATERALS EXERCISE - Olympiad/HOTS CORNER15videos
QUADRILATERALS
- BOOK - MTG IIT JEE FOUNDATIONCHAPTER - TRIANGLESEXERCISE - OLYMPAID/ HOTS CORNER10videos
TRIANGLES
Similar Questions
Draw a frequency polygon for the following grouped frequency distribution table :
 View Solution
Draw a frequency polygon for the following frequency distribution:
 View Solution
Draw a frequency polygon for the following frequency distribution.
 View Solution
Draw a frequency polygon for the following grouped frequency distrbution table.
 View Solution
Draw the frequency polygon for the following frequency distribution:
 View Solution
Draw frequency polygon for the following frequency distribution.
 View Solution
Draw the frequency polygon representing the following frequency distribution
 View Solution
Draw a histogram and frequency polygen to represent the following frequency distribution :
View SolutionDraw histogram and frequency polygon for the following distribution :
 View Solution
The frequency distribution of marks obtained by students in a class test is given below .
Draw frequency polygon and ogive.
 View Solution

