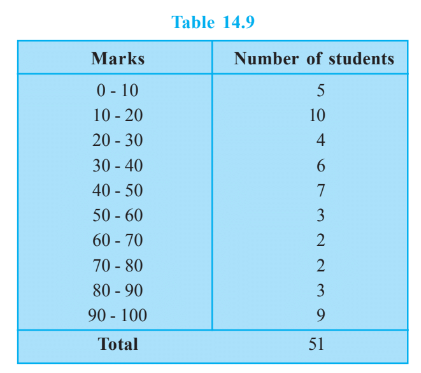
Consider the marks, out of 100, obtained by 51 students of a class in a test, given in Table 14.9

we draw a frequency polygon by drawing a histogram first
calculating points where frequency =0
difference :10-0=10
first point 0+102−10=−5
Last point 90+1002+10=95+10=105
so we plot the points (-5,0)&(105,0)
Similar Questions
Consider the marks, out of 100, obtained by 50 students of a class given in the table.

Draw a frequency polygon corresponding to this frequency distribution table using histogram.
View SolutionThe table given below shows the marks obtained by 50 students of a class in a test with maximum 2. marks 100.

A student of the class is selected at random. Find the probability that the selected student gets
less than 15% marks
View Solution
Knowledge Check
The table given below shows the marks obtained by 80 students of a class in a test with maximum marks 100 .

A student of the class is selected at random .
Find the probability that he gets
(i) less than 15% marks ,
(ii) 60 or more marks and
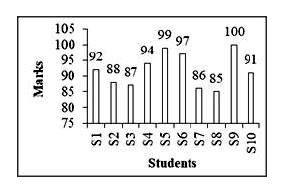
(iii) less than 45 marks .A340, 14, 920B740, 34, 320C940, 34, 1120D1740, 14, 1720The Bar graph given below presents the marks (out of 100) obtained by 10 students in a subject.

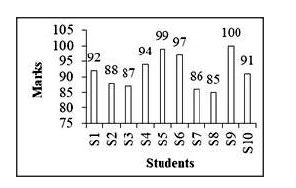
What is the average of the marks obtained by all the students?AA)91.9BB)90.9CC)89.9DD)82.9The Bar graph given below presents the marks (out of 100) obtained by 10 students in a subject.

The average of marks obtained by S3 and 55 is what percent less than the marks obtained by S9?A8%B10%C7%D9%
The table given below shows the marks obtained by 50 students of a class in a test with maximum marks 100.

A student of the class is selected at random. Find the probability that the selected student gets
60% or more marks
View SolutionThe table given below shows the marks obtained by 50 students of a class in a test with maximum marks 100.

A student of the class is selected at random. Find the probability that the selected student gets
marks equal to or greater than 45% but less than 60%.
View SolutionThe marks obtained by 60 students of a class in a methematics test are given

Represent the above data by means of a histogram.
View SolutionThe following table shows the marks obtained by 100 students of a class in a school during a particular academic session. Find the modal marks.

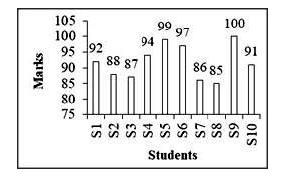
View SolutionThe Bar graph given below presents the marks (out of 100) obtained by 10 students in a subject.

The marks obtained by S5 is how much percent more than the average marks of the students (correct to two decimal)?
View Solution
