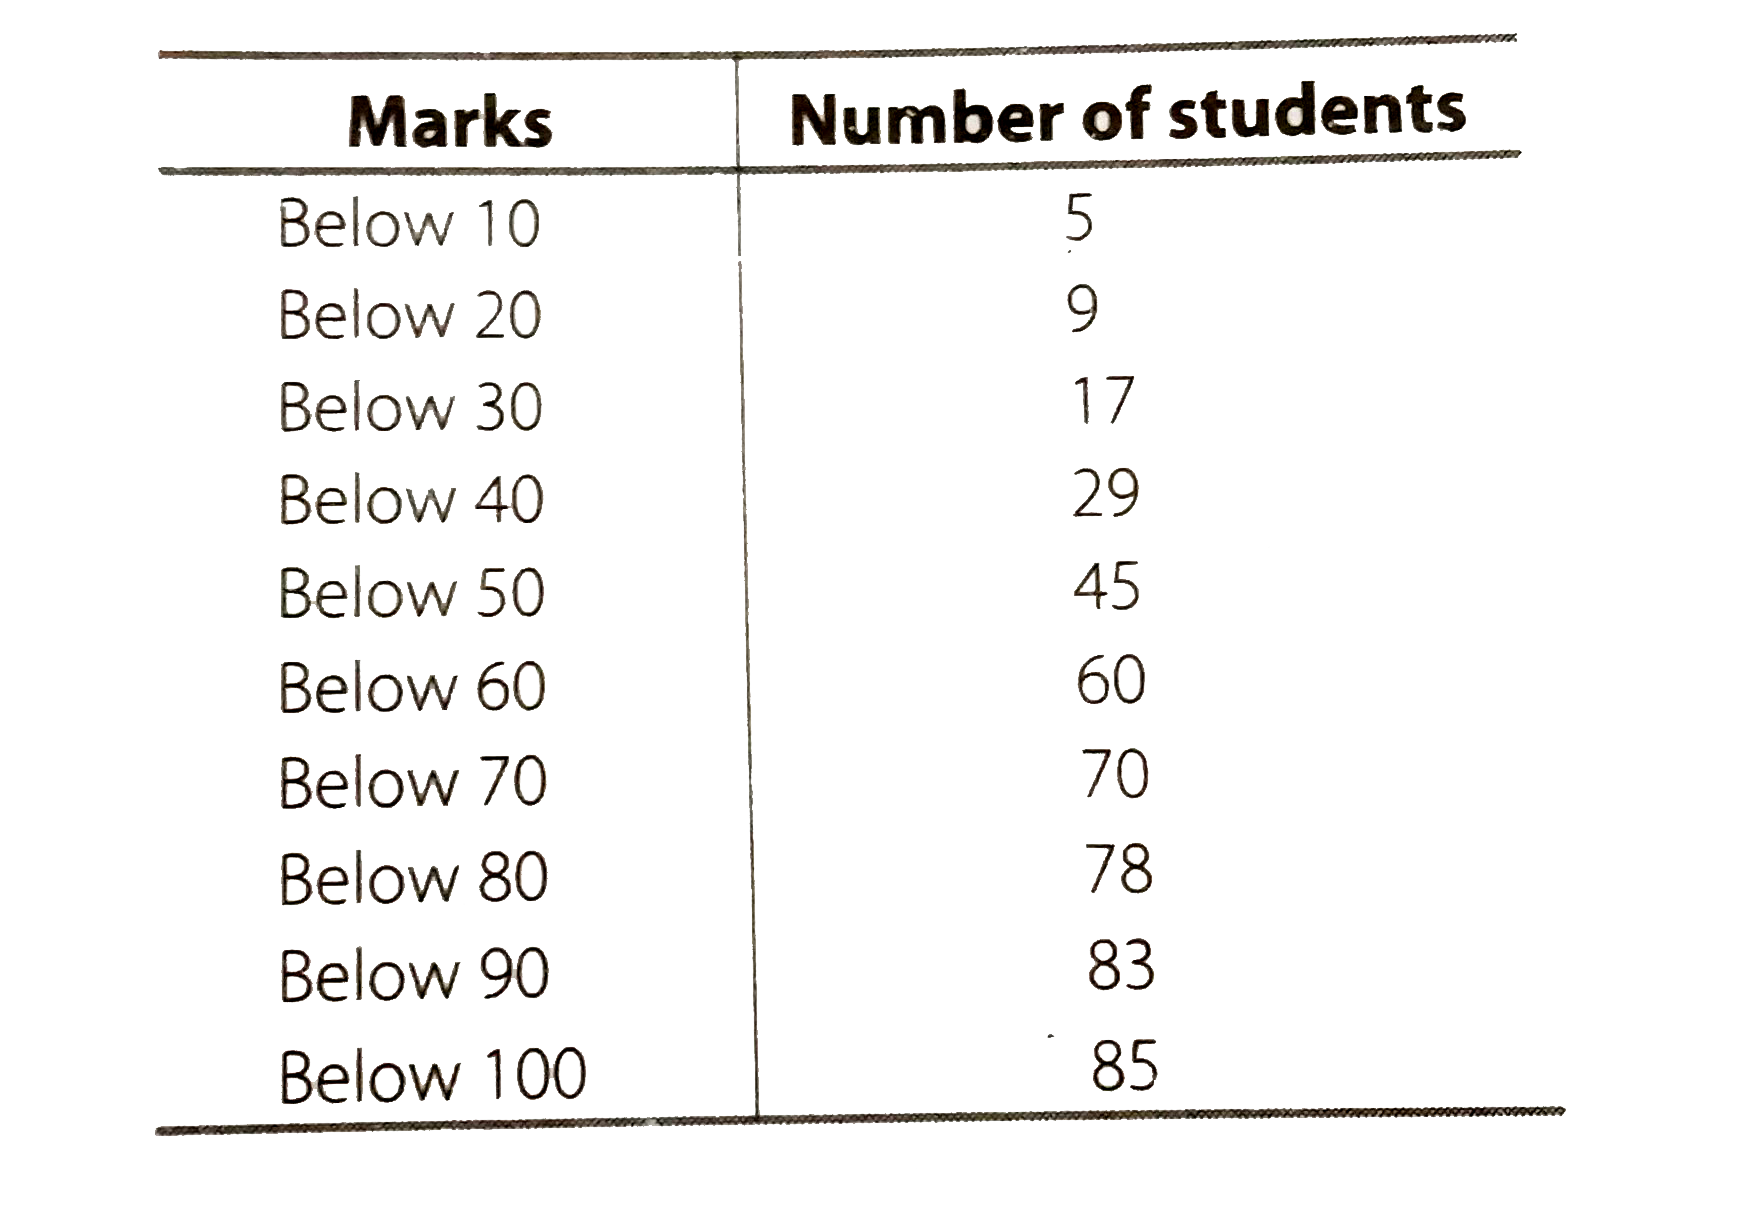
Determine the mean of the following distribution

Video Solution
Text Solution
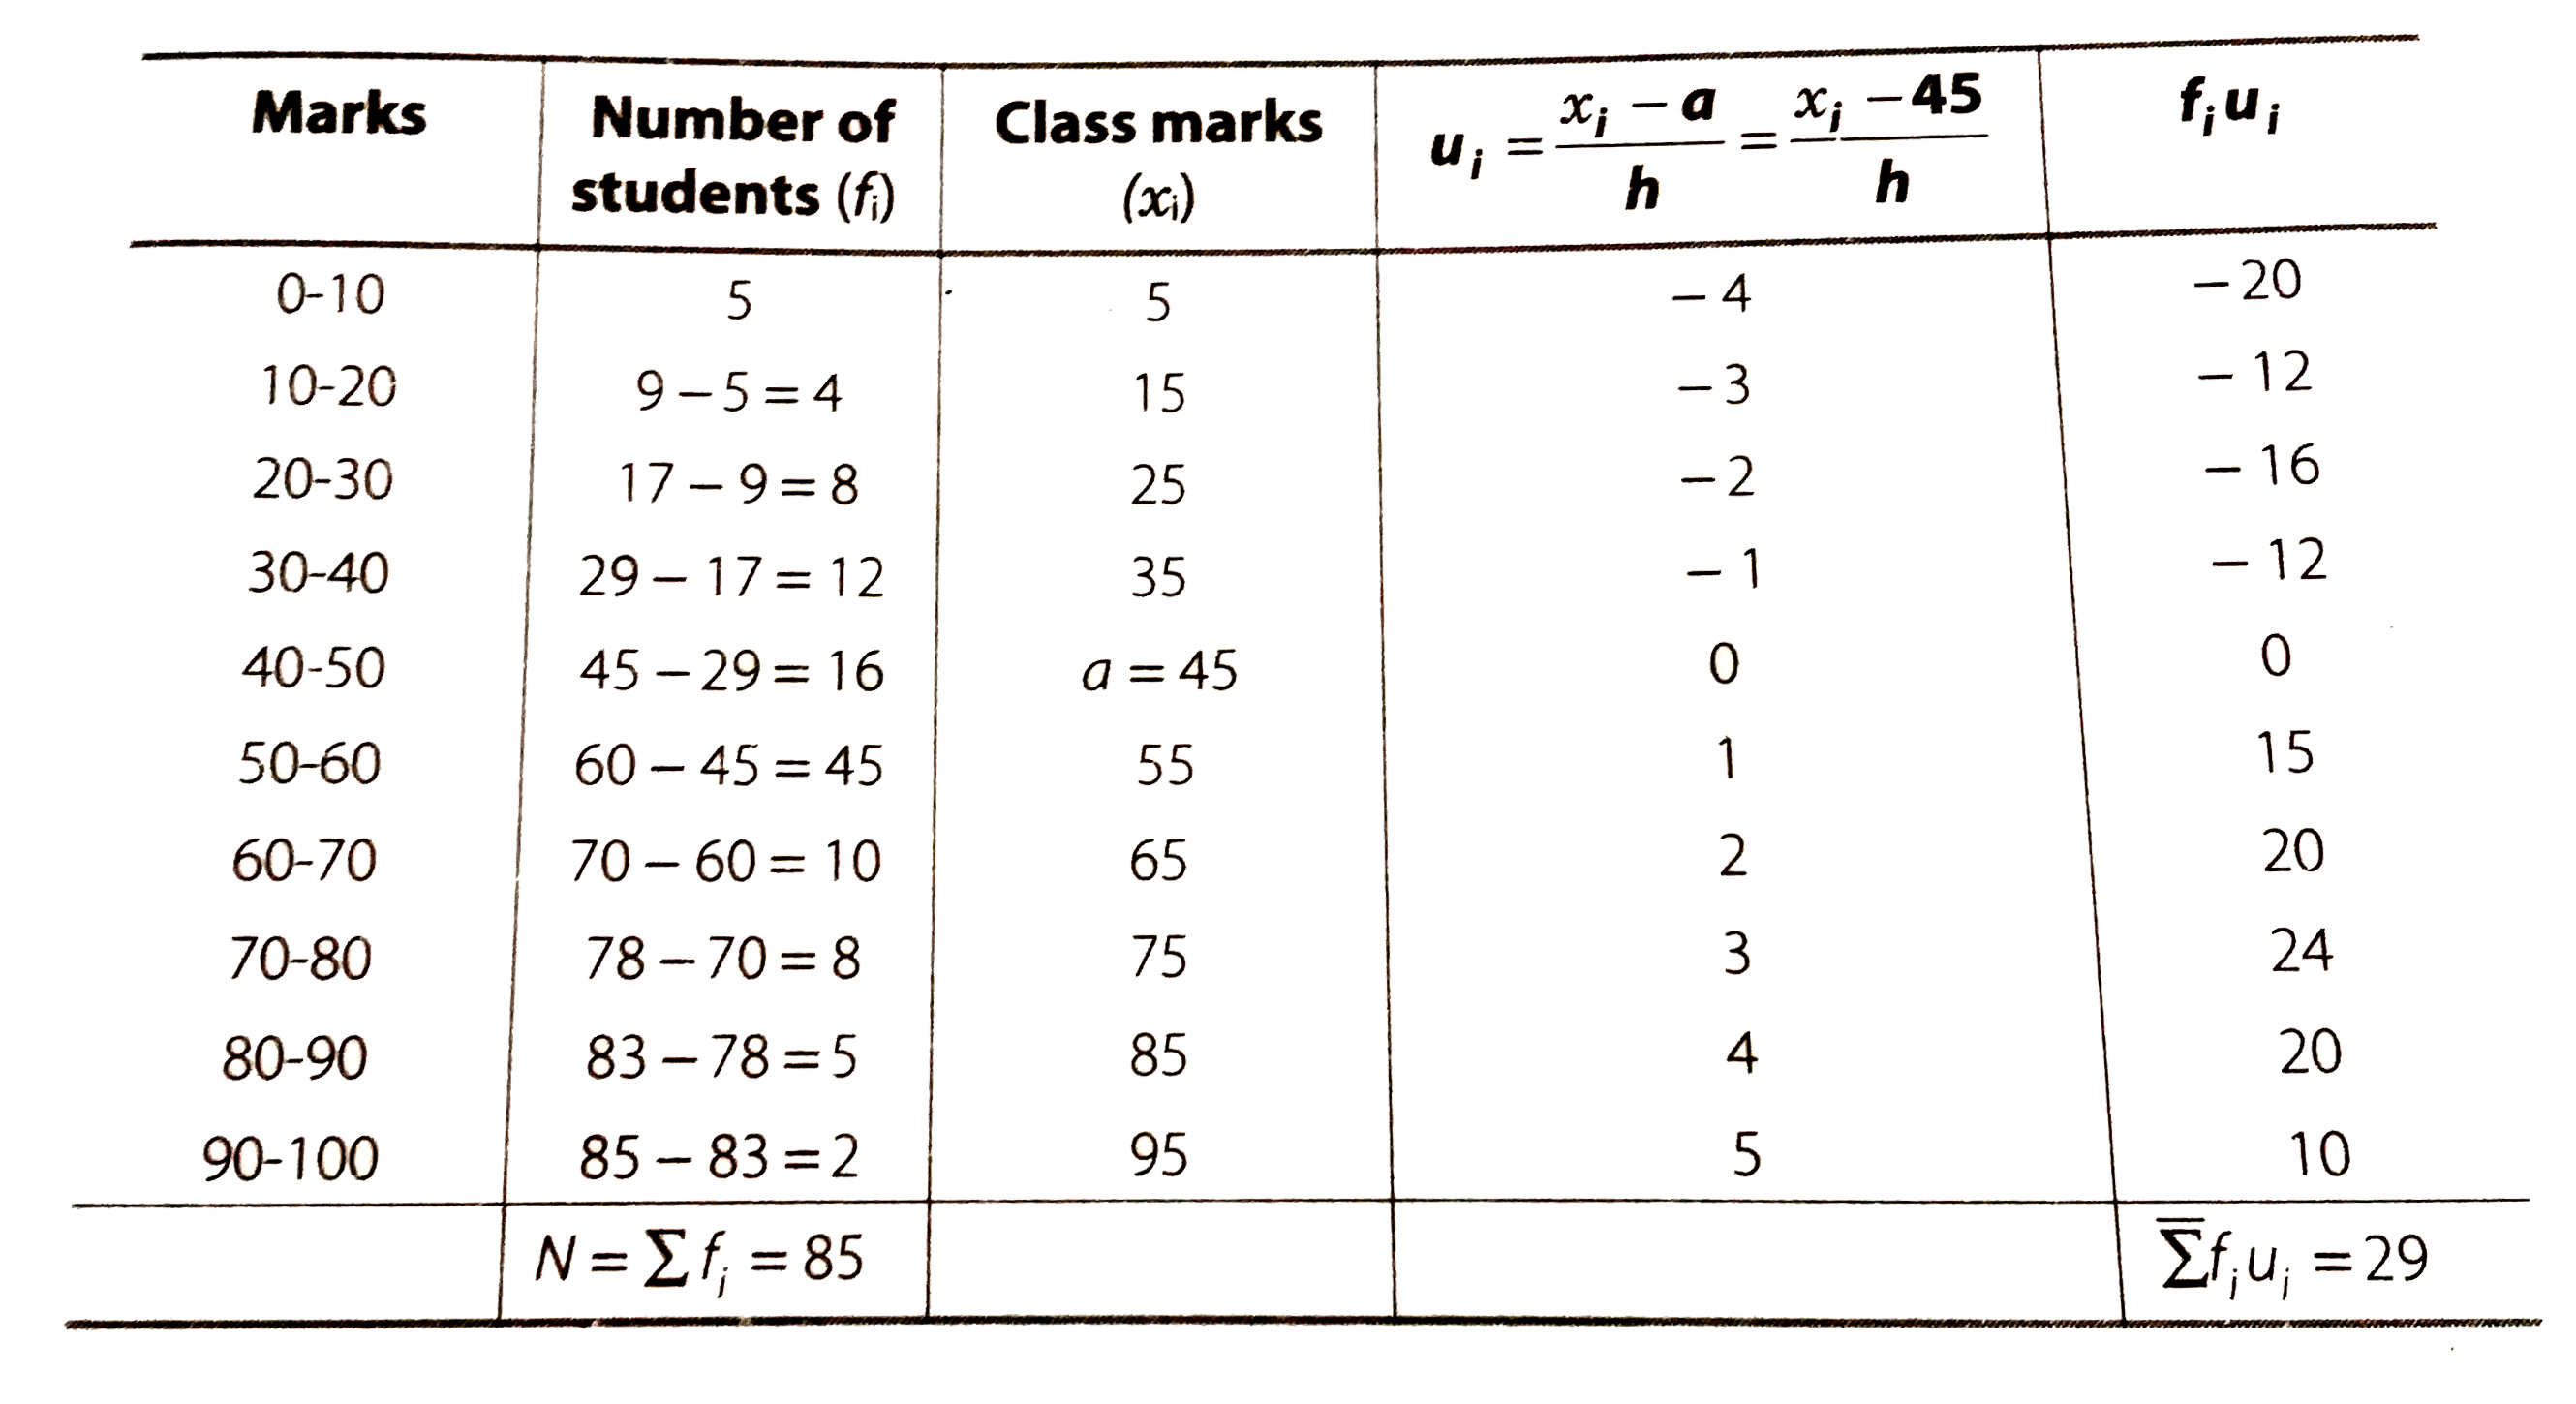
Here, we observe that, 5 students have scored marks below 10 i.e. it lies between class interval 0-10 and 9 students have scored marks below 20. So, (9-5)=4 students lies in the class interval 10-20. Continuing in the same manner, we get the complete frequency distribution table for given data.

Here, (assumed mean)a=45
and (class width)h=10
By step deviation method. Mean(¯x)=a+∑fiui∑fi×h=45+2985×10=45+5817
=45+3.41=48.41
|
Topper's Solved these Questions
- STATISTICS AND PROBABILITYBOOK - NCERT EXEMPLARCHAPTER - STATISTICS AND PROBABILITYEXERCISE - VERY SHORT ANSWERS QUESTIONS
2 Videos
- STATISTICS AND PROBABILITYBOOK - NCERT EXEMPLARCHAPTER - STATISTICS AND PROBABILITYEXERCISE - LONG ASWERS QUESTIONS
5 Videos
- REAL NUMBERSBOOK - NCERT EXEMPLARCHAPTER - REAL NUMBERSEXERCISE - Real Numbers
39 Videos
- SURFACE AREAS AND VOLUMESBOOK - NCERT EXEMPLARCHAPTER - SURFACE AREAS AND VOLUMESEXERCISE - Surface Areas And Volumes
62 Videos
Similar Questions
Knowledge Check
The mean of the following distribution is
 A10B13C12D15
The mean of the following distribution is
 A10B13C12D15
Find the mean of the following distribution.

View SolutionFind the mean of the following distribution.

View SolutionFind the mean of the following distribution:

View SolutionFind the mean of the following distribution:

View SolutionFind the mean of the following distribution :

View SolutionFind the mean of the following distribution:
View Solution

