The distribution of heights (in cm) of 96 children is given below
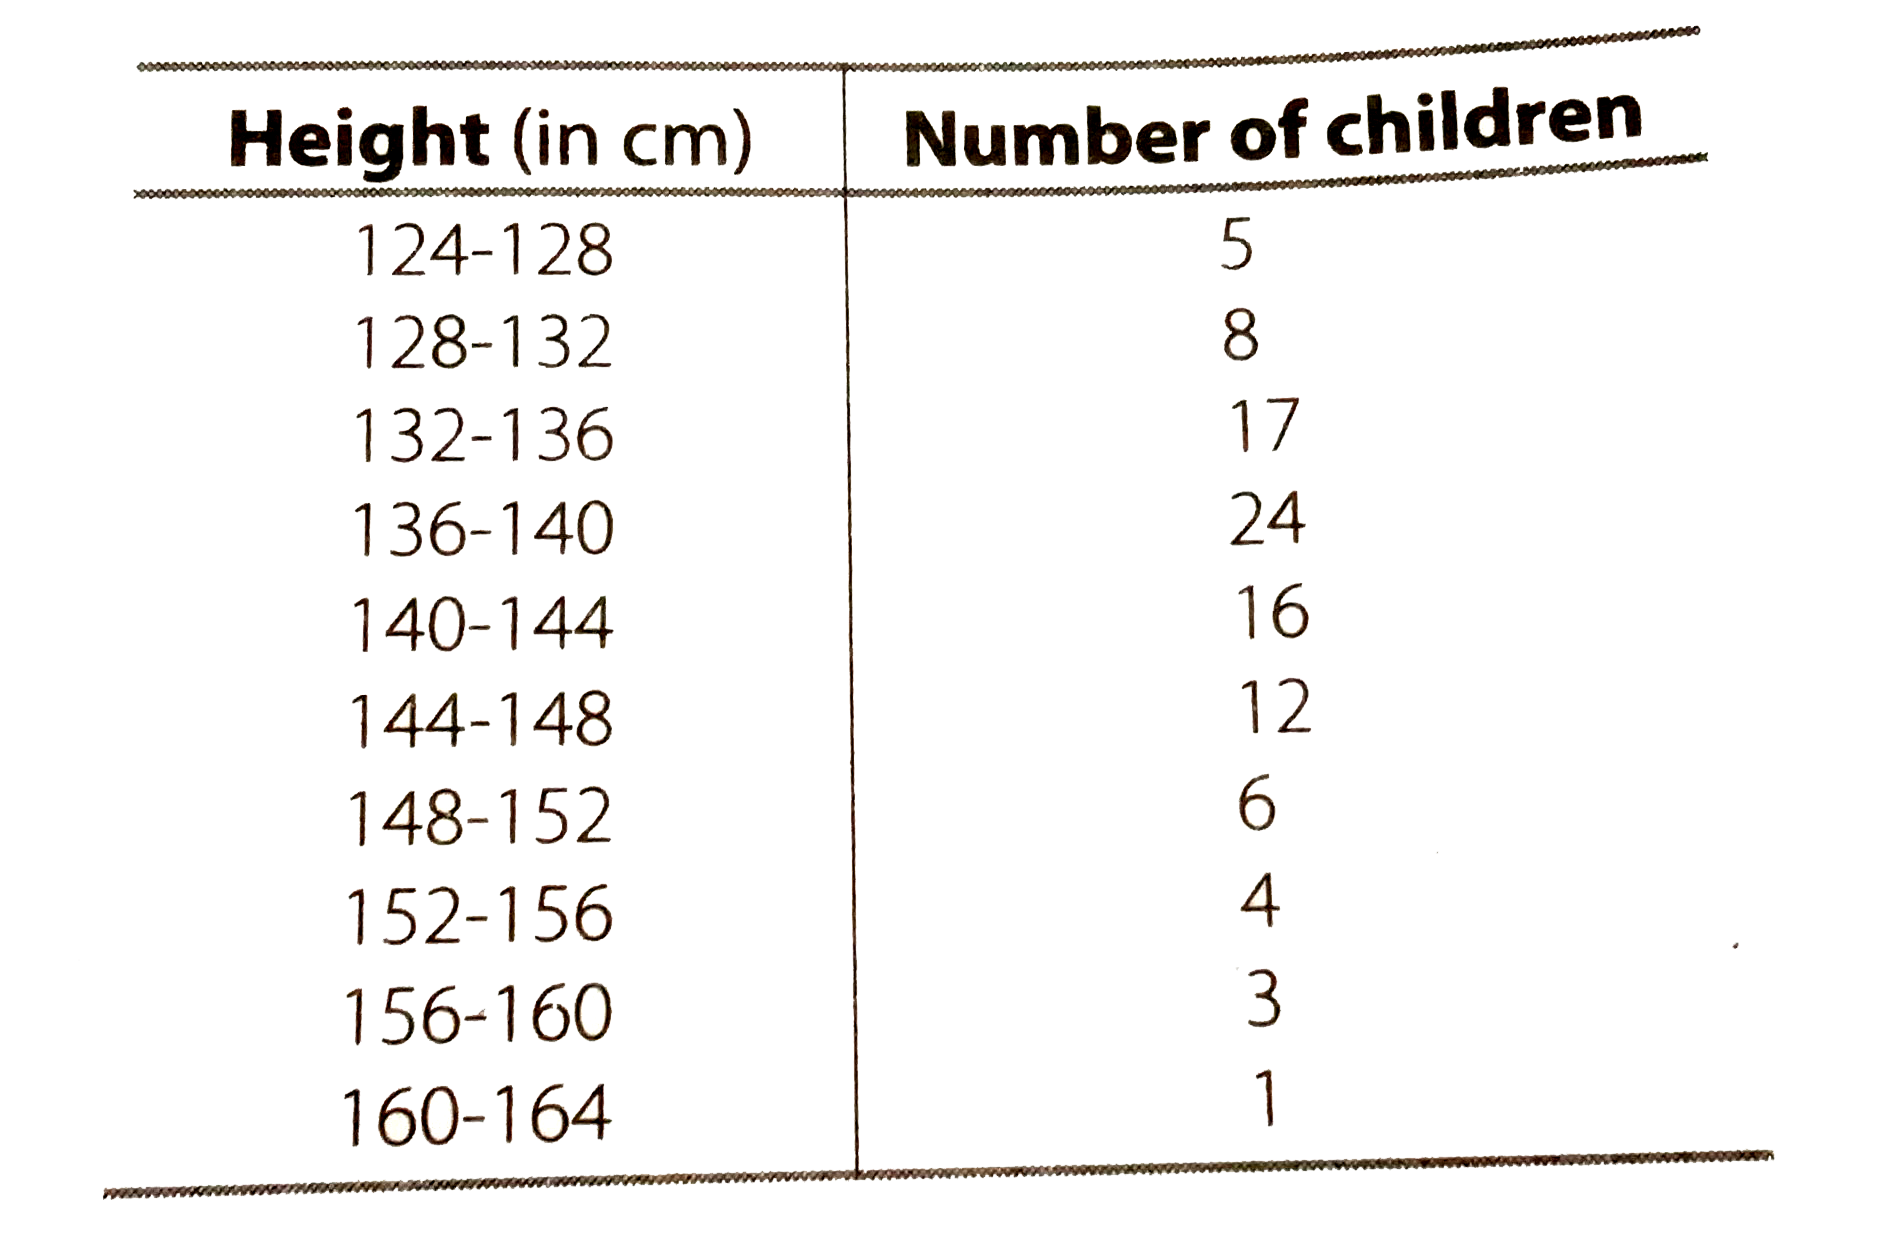
Draw a less type cumulative frequencies curve fo this data and use it to compute meidan height of the children.
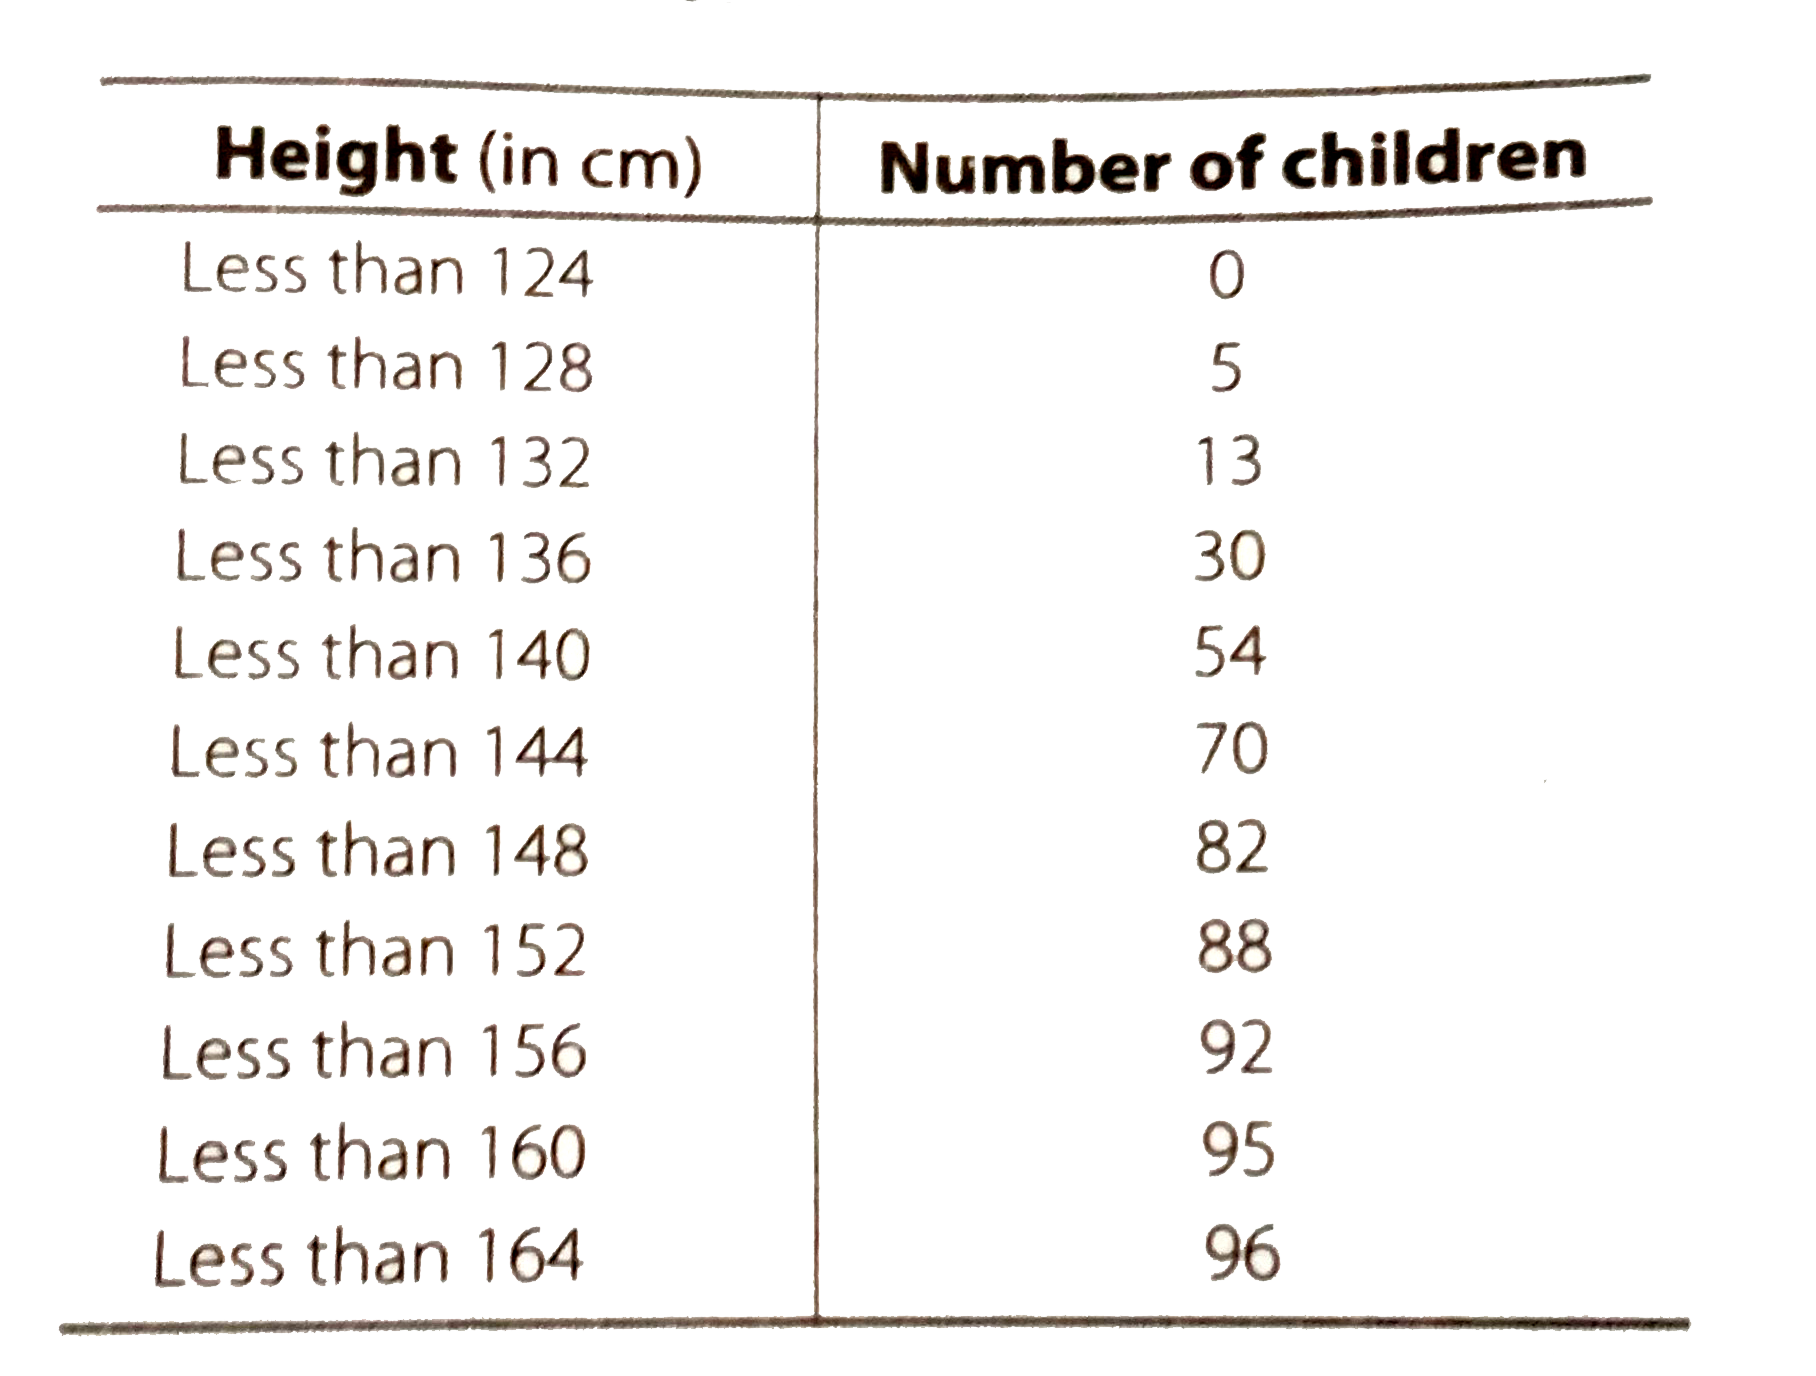
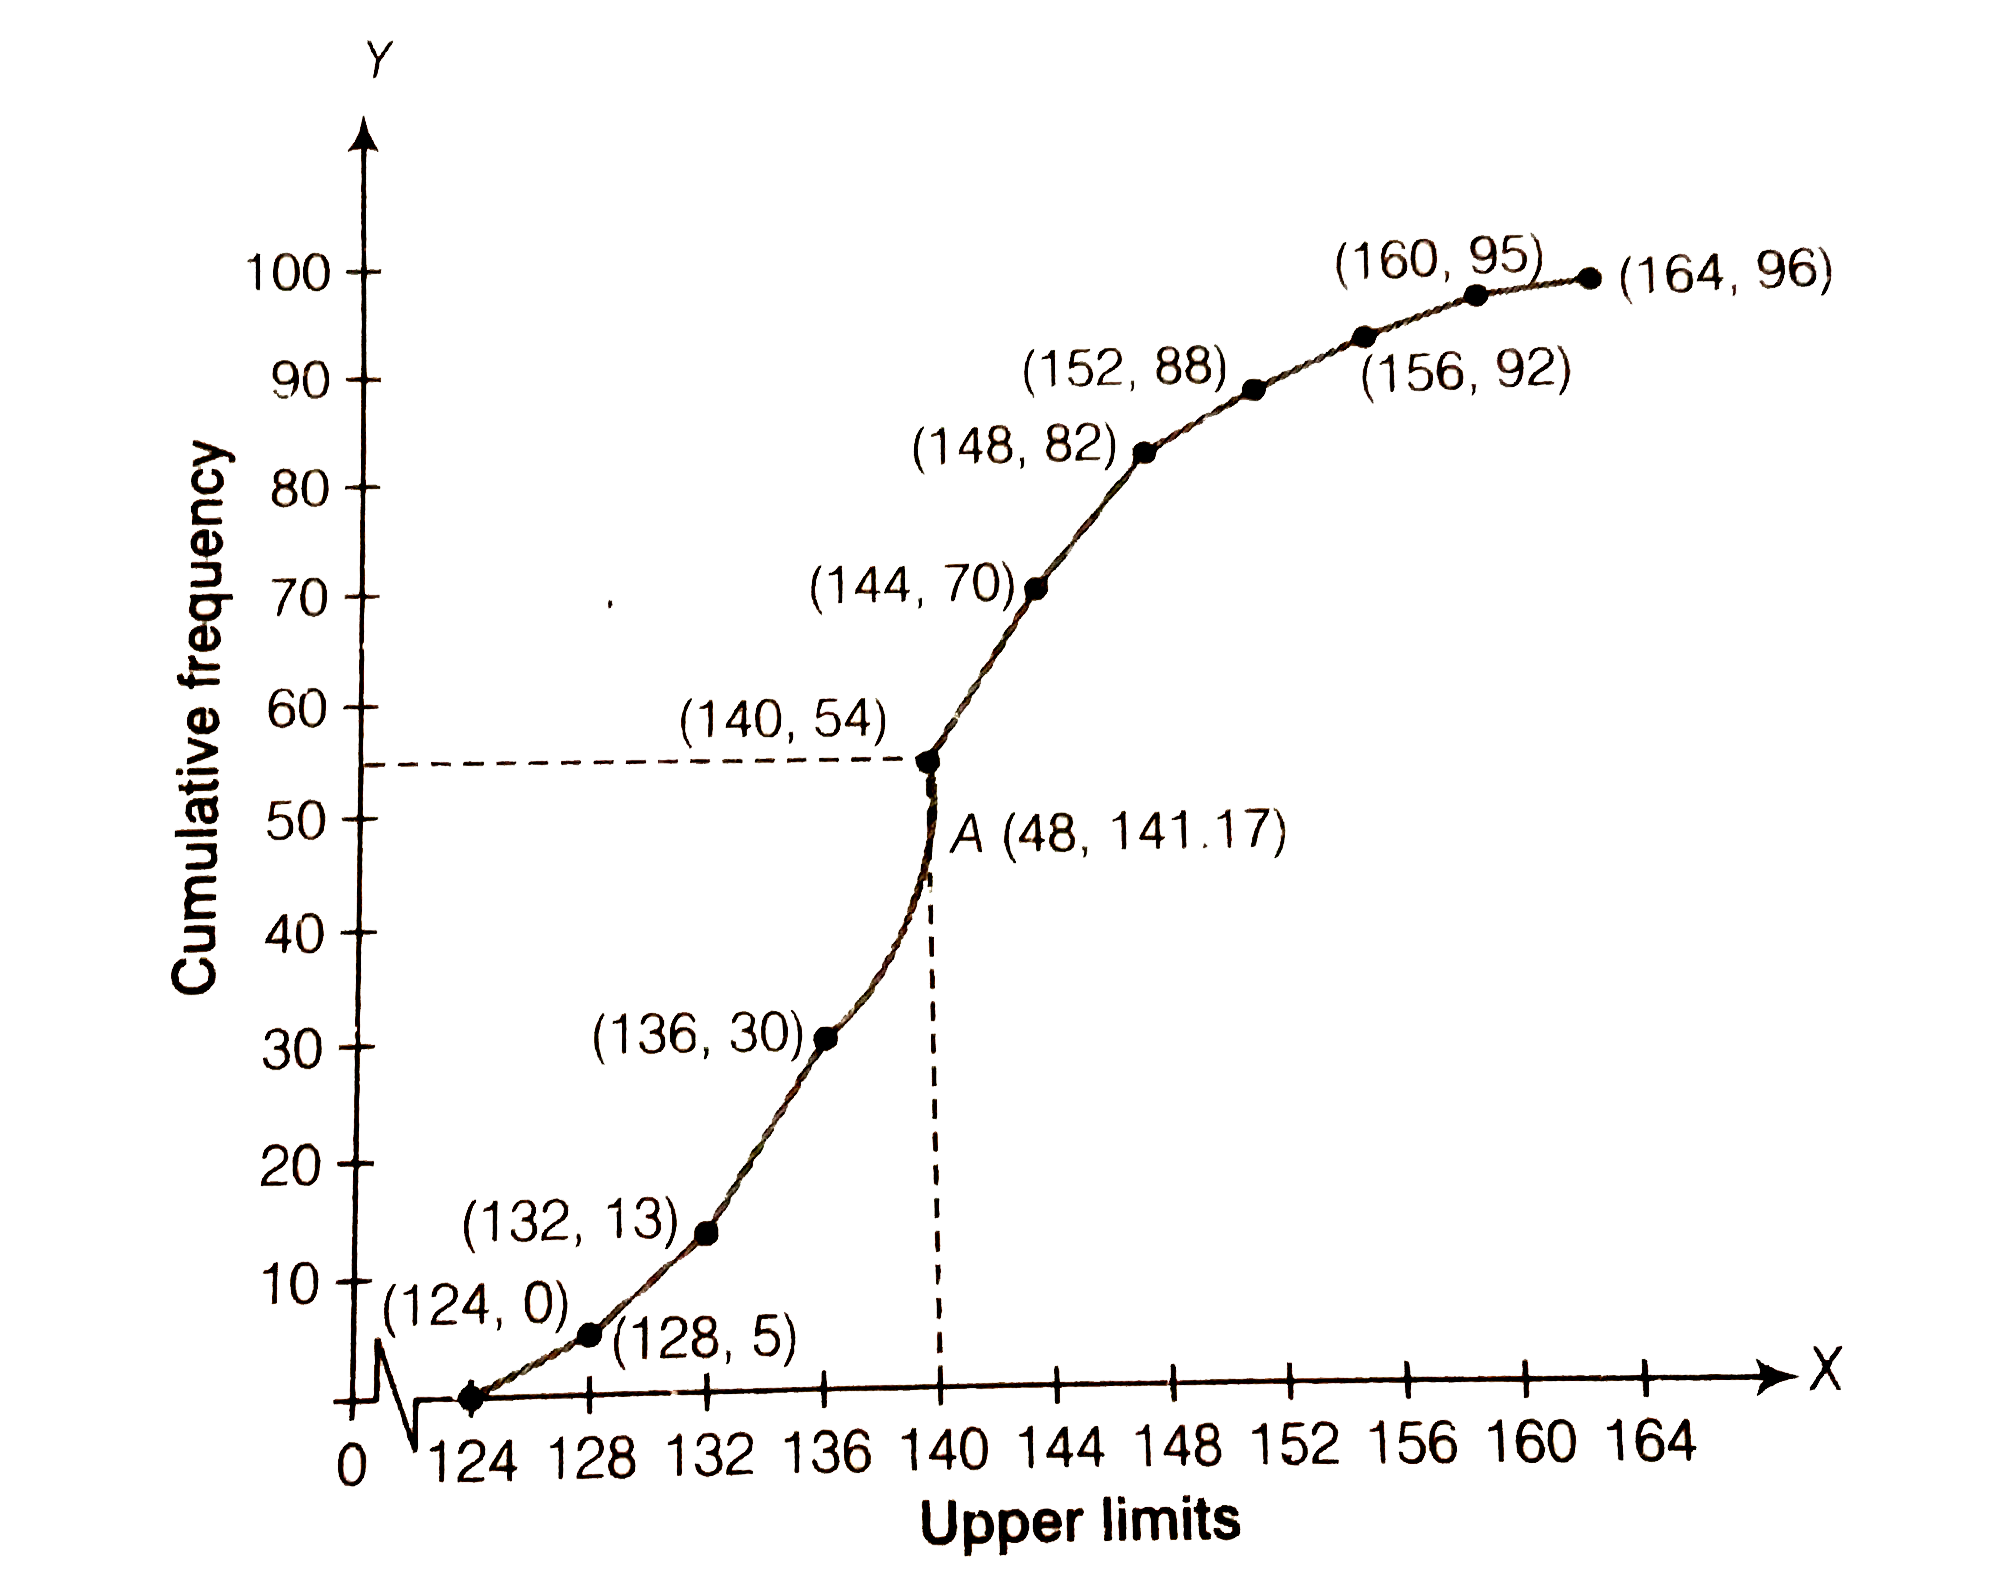
To draw the less than type ogive, we get the points (124,0),(128,5),(132,13),(136,30),(140,54),(144,70),(148,82),(152,88),(156,92),(160,95),(164,96) and join all these points by free hand
Here,
We take, y=48 in y-cordination and draw a line parallel to X-axis meets the curve at A a draw a perpendicular line from point A to the X-axis and this line meets the X-axis at the point which is the median i.e. median=141.17
Topper's Solved these Questions
- STATISTICS AND PROBABILITYBOOK - NCERT EXEMPLARCHAPTER - STATISTICS AND PROBABILITYEXERCISE - VERY SHORT ANSWERS QUESTIONS
2 Videos
- REAL NUMBERSBOOK - NCERT EXEMPLARCHAPTER - REAL NUMBERSEXERCISE - Real Numbers
39 Videos
- SURFACE AREAS AND VOLUMESBOOK - NCERT EXEMPLARCHAPTER - SURFACE AREAS AND VOLUMESEXERCISE - Surface Areas And Volumes
62 Videos
Similar Questions
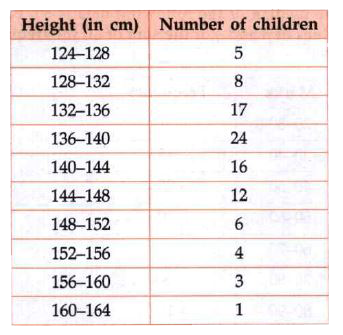
The distribution of heights (in cm) of 96 children is given below:
Draw a less than type cumulative frequency curve for this data and use it to compute median height of the children.
View SolutionThe following table shows the distribution of the heights of a group of factory workers :
Draw the 'less than' cumulative frequency curve on graph paper . Use 2 cm = 5 cm height on one axis and 2 cm = 10 workers on the other
Ht. (cm): 150−155155−160160−165165−170170−175175−180180−185 No. of workers 6 12 18 20 13 8 6
View Solution
Knowledge Check
The abscissa of the point of intersection of the less that type of the more than type cumulative frequency curves of a grouped data gives its
AmeanBmedianCmodeDAll of these
The marks obtained by 100 students of class is an examination are given below:
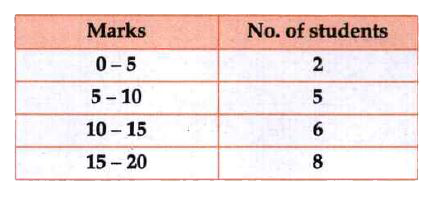
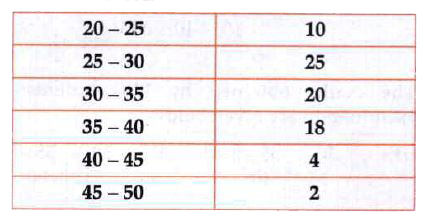
Draw 'a less than' type cumulative frequency curves (ogive). Hence, find median.
View SolutionThe distribution of heights (in cm) of 96 children is given below. Construct a histogram and a frequency polygon on the same axes. Height (in cm):, 124-128, 128-132, 132-136, 136-140, 140-144, 144-148, 148-152, 152-156, 156-160, 160-164 No. of Children, 5, 8, 17, 24, 16, 12, 6, 4, 3, 1
View SolutionThe following is the distribution of weights (in kg) of 40 persons.

Construct a cumulative frequency distribution (of the less than type) table for the data above.
View SolutionThe following is the distribution of weights (in kg) of 40 persons.

Construct a cumulative frequency distribution (of the less than type) table for the data above.
View SolutionThe abscissa of the point of intersection of the less that type of the more than type cumulative frequency curves of a grouped data gives its
View SolutionFor the following frequency distribution, draw a cumulative frequency curve of more than type and hence obtain the median value:

View SolutionA data constitutes of heights (in cm) of 50 children. What do you understand by mode for the data?
View Solution
