Draw a histogram for the frequency table made for the data in Question 3, and answer the following questions.(i) Which group has the maximum number of workers?(ii) How many workers earn Rs 850 and more?(iii) How many workers earn less than Rs 850?
To solve the question, we will follow these steps:
Step 1: Draw the Histogram
1. Identify the axes: The x-axis will represent the wage ranges, while the y-axis will represent the number of workers.
2. Label the axes:
- X-axis: Wage ranges (e.g., 800-810, 810-820, etc.)
- Y-axis: Number of workers (0 to 10)
3. Plot the bars: For each wage range, draw a rectangular bar with a height corresponding to the frequency of workers in that range.
Step 2: Analyze the Histogram
1. Identify the group with the maximum number of workers: Look for the tallest bar in the histogram.
2. Count workers earning Rs 850 and more: Add the frequencies of the groups that are Rs 850 and above.
3. Count workers earning less than Rs 850: Add the frequencies of the groups that are below Rs 850.
Detailed Solution
1. Draw the Histogram:
- For the wage range 800-810, frequency = 3. Draw a bar up to height 3.
- For the wage range 810-820, frequency = 2. Draw a bar up to height 2.
- For the wage range 820-830, frequency = 1. Draw a bar up to height 1.
- For the wage range 830-840, frequency = 9. Draw a bar up to height 9.
- For the wage range 840-850, frequency = 5. Draw a bar up to height 5.
- For the wage range 850-860, frequency = 1. Draw a bar up to height 1.
- For the wage range 860-870, frequency = 3. Draw a bar up to height 3.
- For the wage range 870-880, frequency = 1. Draw a bar up to height 1.
- For the wage range 880-890, frequency = 1. Draw a bar up to height 1.
- For the wage range 890-900, frequency = 4. Draw a bar up to height 4.
2. Maximum Number of Workers:
- The group with the maximum number of workers is from 830 to 840, with a frequency of 9.
3. Workers Earning Rs 850 and More:
- The groups that earn Rs 850 and more are:
- 850-860 (frequency = 1)
- 860-870 (frequency = 3)
- 870-880 (frequency = 1)
- 880-890 (frequency = 1)
- 890-900 (frequency = 4)
- Total = 1 + 3 + 1 + 1 + 4 = 10 workers.
4. Workers Earning Less than Rs 850:
- The groups that earn less than Rs 850 are:
- 800-810 (frequency = 3)
- 810-820 (frequency = 2)
- 820-830 (frequency = 1)
- 830-840 (frequency = 9)
- 840-850 (frequency = 5)
- Total = 3 + 2 + 1 + 9 + 5 = 20 workers.
Summary of Answers
(i) The group with the maximum number of workers is 830 to 840.
(ii) The number of workers earning Rs 850 and more is 10.
(iii) The number of workers earning less than Rs 850 is 20.
1. Identify the axes: The x-axis will represent the wage ranges, while the y-axis will represent the number of workers.
2. Label the axes:
- X-axis: Wage ranges (e.g., 800-810, 810-820, etc.)
- Y-axis: Number of workers (0 to 10)
3. Plot the bars: For each wage range, draw a rectangular bar with a height corresponding to the frequency of workers in that range.
1. Identify the group with the maximum number of workers: Look for the tallest bar in the histogram.
2. Count workers earning Rs 850 and more: Add the frequencies of the groups that are Rs 850 and above.
3. Count workers earning less than Rs 850: Add the frequencies of the groups that are below Rs 850.
1. Draw the Histogram:
- For the wage range 800-810, frequency = 3. Draw a bar up to height 3.
- For the wage range 810-820, frequency = 2. Draw a bar up to height 2.
- For the wage range 820-830, frequency = 1. Draw a bar up to height 1.
- For the wage range 830-840, frequency = 9. Draw a bar up to height 9.
- For the wage range 840-850, frequency = 5. Draw a bar up to height 5.
- For the wage range 850-860, frequency = 1. Draw a bar up to height 1.
- For the wage range 860-870, frequency = 3. Draw a bar up to height 3.
- For the wage range 870-880, frequency = 1. Draw a bar up to height 1.
- For the wage range 880-890, frequency = 1. Draw a bar up to height 1.
- For the wage range 890-900, frequency = 4. Draw a bar up to height 4.
- The group with the maximum number of workers is from 830 to 840, with a frequency of 9.
- The groups that earn Rs 850 and more are:
- 850-860 (frequency = 1)
- 860-870 (frequency = 3)
- 870-880 (frequency = 1)
- 880-890 (frequency = 1)
- 890-900 (frequency = 4)
- Total = 1 + 3 + 1 + 1 + 4 = 10 workers.
- The groups that earn less than Rs 850 are:
- 800-810 (frequency = 3)
- 810-820 (frequency = 2)
- 820-830 (frequency = 1)
- 830-840 (frequency = 9)
- 840-850 (frequency = 5)
- Total = 3 + 2 + 1 + 9 + 5 = 20 workers.
(i) The group with the maximum number of workers is 830 to 840.
(ii) The number of workers earning Rs 850 and more is 10.
(iii) The number of workers earning less than Rs 850 is 20.
Topper's Solved these Questions
- DATA HANDLINGBOOK - NCERT ENGLISHCHAPTER - DATA HANDLINGEXERCISE - EXERCISE 5.2
5 Videos
- DATA HANDLINGBOOK - NCERT ENGLISHCHAPTER - DATA HANDLINGEXERCISE - SOLVED EXAMPLES
1 Videos
- DATA HANDLINGBOOK - NCERT ENGLISHCHAPTER - DATA HANDLINGEXERCISE - SOLVED EXAMPLES
1 Videos
- CUBES AND CUBE ROOTSBOOK - NCERT ENGLISHCHAPTER - CUBES AND CUBE ROOTSEXERCISE - SOLVED EXAMPLES
8 Videos
- DIRECT AND INVERSE PROPORTIONSBOOK - NCERT ENGLISHCHAPTER - DIRECT AND INVERSE PROPORTIONSEXERCISE - EXERCISE 13.1
10 Videos
Similar Questions
The weekly wages (in Rs.) of 30 workers in a factory are give: 830,835,890,810,835,836,869,845,898,890, 820,860,832,833,855,845,804,808,812,,840,885,835,835,836,878,840,868,890,806,840 Mark a frequency table with intervals as 800-810, 810-820 and so on, using tally marks. Also, draw a histogram and answer the following questions: Which group has the maximum number of workers? How many workers earn Rs. 850 and more? How many workers earn less than Rs. 850?
View SolutionFollowing pictograph shows the number of tractors in five villages. Observe the pictograph and answer the following questions. (i) Which village has the minimum number of tractors? (ii) Which village has the maximum number of tractors? (iii) How many more tractors village C has as compared to village B. (iv) What is the total number of tractors in all the five villages?
View SolutionThe number of hours television watched in a day by the students of a particular class during holidays is shown in the following histogram: Look at the histogram and answer the following questions: 1. For how many hours the maximum number of students watch TV? 2. How many students watch TV for less than 4 hours? 3. How many students spend more than 5 hours in watching TV?
View SolutionUse the bar graph (Fig 3.3) to answer the following questions.(a) Which is the most popular pet? (b) How many children have dog as a pet?
View SolutionIn a village six fruit merchants sold the following number of fruit baskets in a particular season : Observe this pictograph and answer the following questions : (a) Which merchant sold the maximum number of baskets? (b) How many fruit baskets were sold by Anwar? (c) The merchants who have sold 600 or more number of baskets are planning to buy a godown for the next season. Can you name them?
View SolutionIn a village six fruit merchants sold the following number of fruit baskets in a particularseason :Observe this pictograph and answer the following questions :(a) Which merchant sold the maximum number of baskets?(b) How many fruit baskets were sold by Anwar?(c) The merchants who have sold 600 or more number of baskets are planning to buya godown for the next season. Can you name them?
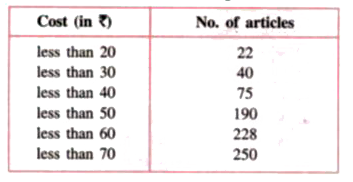
View SolutionThe cost of 250 articles is given below :

Construct a frquency distribution table for the data given above. Also , answer the following:
(i) how many articles cost from rupes 30 to less than rupes 50?
how many articles have cost at most rupes 40 ?
(iii) how many articles have cost at least rupes 50?
View SolutionThe number of girl students in each class of a co-educational middle school is depicted by the pictograph Observe this pictograph and answer the following questions :(a) Which class has the minimum number of girl students?(b) Is the number of girls in Class VI less than the number of girls in Class V?(c) How many girls are there in Class VII?
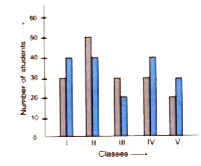
View SolutionExmine the given graph carefully.

In the graph show above represents the number of girls in a particular class and represents the number of boys in the same class.
Read and answer the following questions.
(i) Which class has the least number of students ?
(ii) Which class has maximum number of students ?
(iii) What is the ratio between the number of girls and the number of boys of class V.
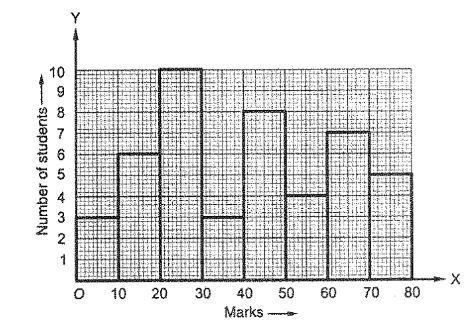
View SolutionThe following histogram depicts the marks obtained by 45 students of a class: Figure: Look at the histogram and answer the following questions: What is the class size? How many students obtained less than 10 marks? How many students obtained 30 or more marks but less than 40? What is the interval of highest marks and how many students are there in this interval? If passing marks are 30, what is the number of failures?

View Solution
