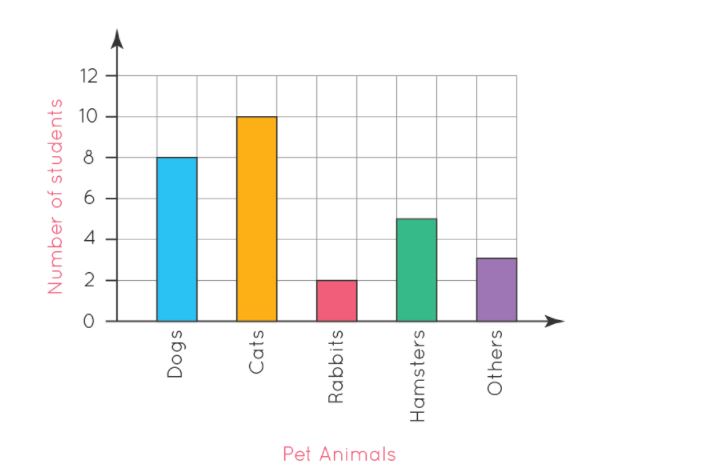
Use the bar graph (Fig 3.3) to answer the following questions.(a) Which is the most popular pet? (b) How many children have dog as a pet?
We study the given bar graph and extract the required information.
From the given bar graph in the figure, we have
(i) Cats are the most popular pet among the students as 10 students have cats as their pets.
(ii) 8 students have dogs as a pet animals.

Topper's Solved these Questions
- DATA HANDLINGBOOK - NCERT ENGLISHCHAPTER - DATA HANDLINGEXERCISE - EXERCISE 3.1
8 Videos
- DATA HANDLINGBOOK - NCERT ENGLISHCHAPTER - DATA HANDLINGEXERCISE - EXERCISE 3.2
5 Videos
- DATA HANDLINGBOOK - NCERT ENGLISHCHAPTER - DATA HANDLINGEXERCISE - EXERCISE 3.4
4 Videos
- CONGRUENCE OF TRIANGLESBOOK - NCERT ENGLISHCHAPTER - CONGRUENCE OF TRIANGLESEXERCISE - SOLVED EXAMPLES
9 Videos
- EXPONENTS AND POWERSBOOK - NCERT ENGLISHCHAPTER - EXPONENTS AND POWERSEXERCISE - EXERCISE 13.2
5 Videos
Similar Questions
Following is a bar graph giving the approximate heights of five mountain peaks. Read the graph and answer the following questions.
Which is the highest peak and what is its height?

View SolutionGiven below is a bar graph showing the heights of five mountain peaks.
Read the bar graph carefully and answer the following questions:
(i) Which is the highest peak and what is its height?
(ii) What is the ratio of the heights of the highest peak and the next highest peak?
(iii) Arrange the heights of the given peaks in descending order.
View SolutionRead the bar graph shown in Figure and answer the following questions: What is the information given by the bar graph? How many tickets of Assam State Lottery were sold by the agent? Of which state, were the maximum number of tickets sold? State whether true or false. The maximum number of tickets sold is three times the minimum number of tickets sold. Of which state were the minimum number of tickets sold?
View SolutionRead the bar graph and answer the following questions.
in which year the value of the export is greater than that of the import?

View SolutionRead the following bar graph (Figure) and answer the following questions: What is the information given by the bar graph? State each of the following whether true or false. The number of government companies in 1957 is that of 1982 is 1:9. The number of government companies have decreased over the year 1957 to 1983
View SolutionAnswer the following question:
How many end points does a ray AB have ?
View SolutionRead the bar graph given in Figure and answer the following questions: What is the information given by the bar graph? What is the number of families having 6 members? How many member per family are there in the maximum number of families? Also tell the number of such families. What are the number of members per family for which the number of families are equal? Also, tell the number of such families?
View SolutionDraw a histogram for the frequency table made for the data in Question 3, and answer the following questions.(i) Which group has the maximum number of workers?(ii) How many workers earn Rs 850 and more?(iii) How many workers earn less than Rs 850?
View SolutionRead the adjoining bar graph showing the number ofstudents in a particular class of a school. Answer thefollowing questions :(a) What is the scale of this graph?(b) How many new students are added every year?(c) Is the number of students in the year 2003 twice that in the year 2000?
View SolutionRead the bar graph given in Figure and answer the following questions: What information is given by the bar graph? In which years the areas under the sugarcane crop were the maximum and the minimum? State whether true or false: The area under the sugarcane crop in the year 1982-83 is three times that of the year 1950-51
View Solution
