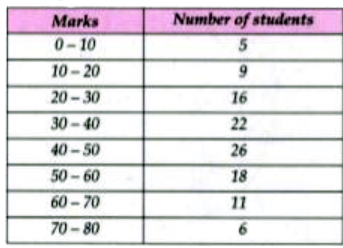
Draw less than and more than ogive on the same graph and estimate median :

Step by step video & image solution for Draw less than and more than ogive on the same graph and estimate median : by Maths experts to help you in doubts & scoring excellent marks in Class 10 exams.
Updated on:21/07/2023Topper's Solved these Questions
- STATISTICS BOOK - NAGEEN PRAKASHAN ENGLISHCHAPTER - STATISTICS EXERCISE - Revision Exercise Very Short Answer Questions
9 Videos
- STATISTICS BOOK - NAGEEN PRAKASHAN ENGLISHCHAPTER - STATISTICS EXERCISE - Revision Exercise Short Answer Questions
5 Videos
- STATISTICS BOOK - NAGEEN PRAKASHAN ENGLISHCHAPTER - STATISTICS EXERCISE - Exercise 14 D
5 Videos
- SOME APPLICATIONS OF TRIGONOMETRYBOOK - NAGEEN PRAKASHAN ENGLISHCHAPTER - SOME APPLICATIONS OF TRIGONOMETRYEXERCISE - Long Answer Questions
5 Videos
- TRIANGLES BOOK - NAGEEN PRAKASHAN ENGLISHCHAPTER - TRIANGLES EXERCISE - Revision Exercise Long Questions
1 Videos
Similar Questions
Draw a more than ogive from the given data and estimate median with the help of ogive. :

View SolutionConstruct a less than ogive and a more than ogive from the following data :

View SolutionFor a given data with 70 observations the less then ogive and the more than ogive intersect at (20.5,35). The median of the data is
(a)20
(b) 35
(c) 70
(d) 20.5
View SolutionDuring the medical check-up of 35 students of a class, their weights were recorded as follows: Draw a less than type ogive for the given data. Hence obtain the median weight from the graph and verify the result by using the formula. weight (in kg)=38-40 40-42 42-44 44-46 46-48 48-50 50-52 No. of students=3 2 4 5 14 4 3
View SolutionFor the following data, draw a 'less than' ogive and hence find the median of the distribution.

View SolutionDraw a less than cumulative curve (ogive to represent the data.

Also, find the mdian with the help of less than ogive.
View SolutionUse graph paper for this question.
The marks obtained by 120 students in an English test are given below :


Draw the ogive and hence, estimate :
the median marks.
View SolutionThe marks obtained by 120 students in a Mathematics test are given below:

Using the informations, given above, draw an ogive on a graph sheet. Take a suitable scale for your ogive. Use the ogive drawn to estimate :
(i) the median.
(ii) the number of students who obtained more than 75% marks in the test.
(iii) the number of students who did not pass in the test if the pass percentage was 40.
View SolutionThe result of an examination is tabulated below:

Draw the ogive for the above data and from it determine:
the number of candidates who got marks less than 45
View SolutionThe result of an examination is tabulated below:

Draw the ogive for the above data and from it determine:
the number of candidates who got marks more than 75
View Solution
