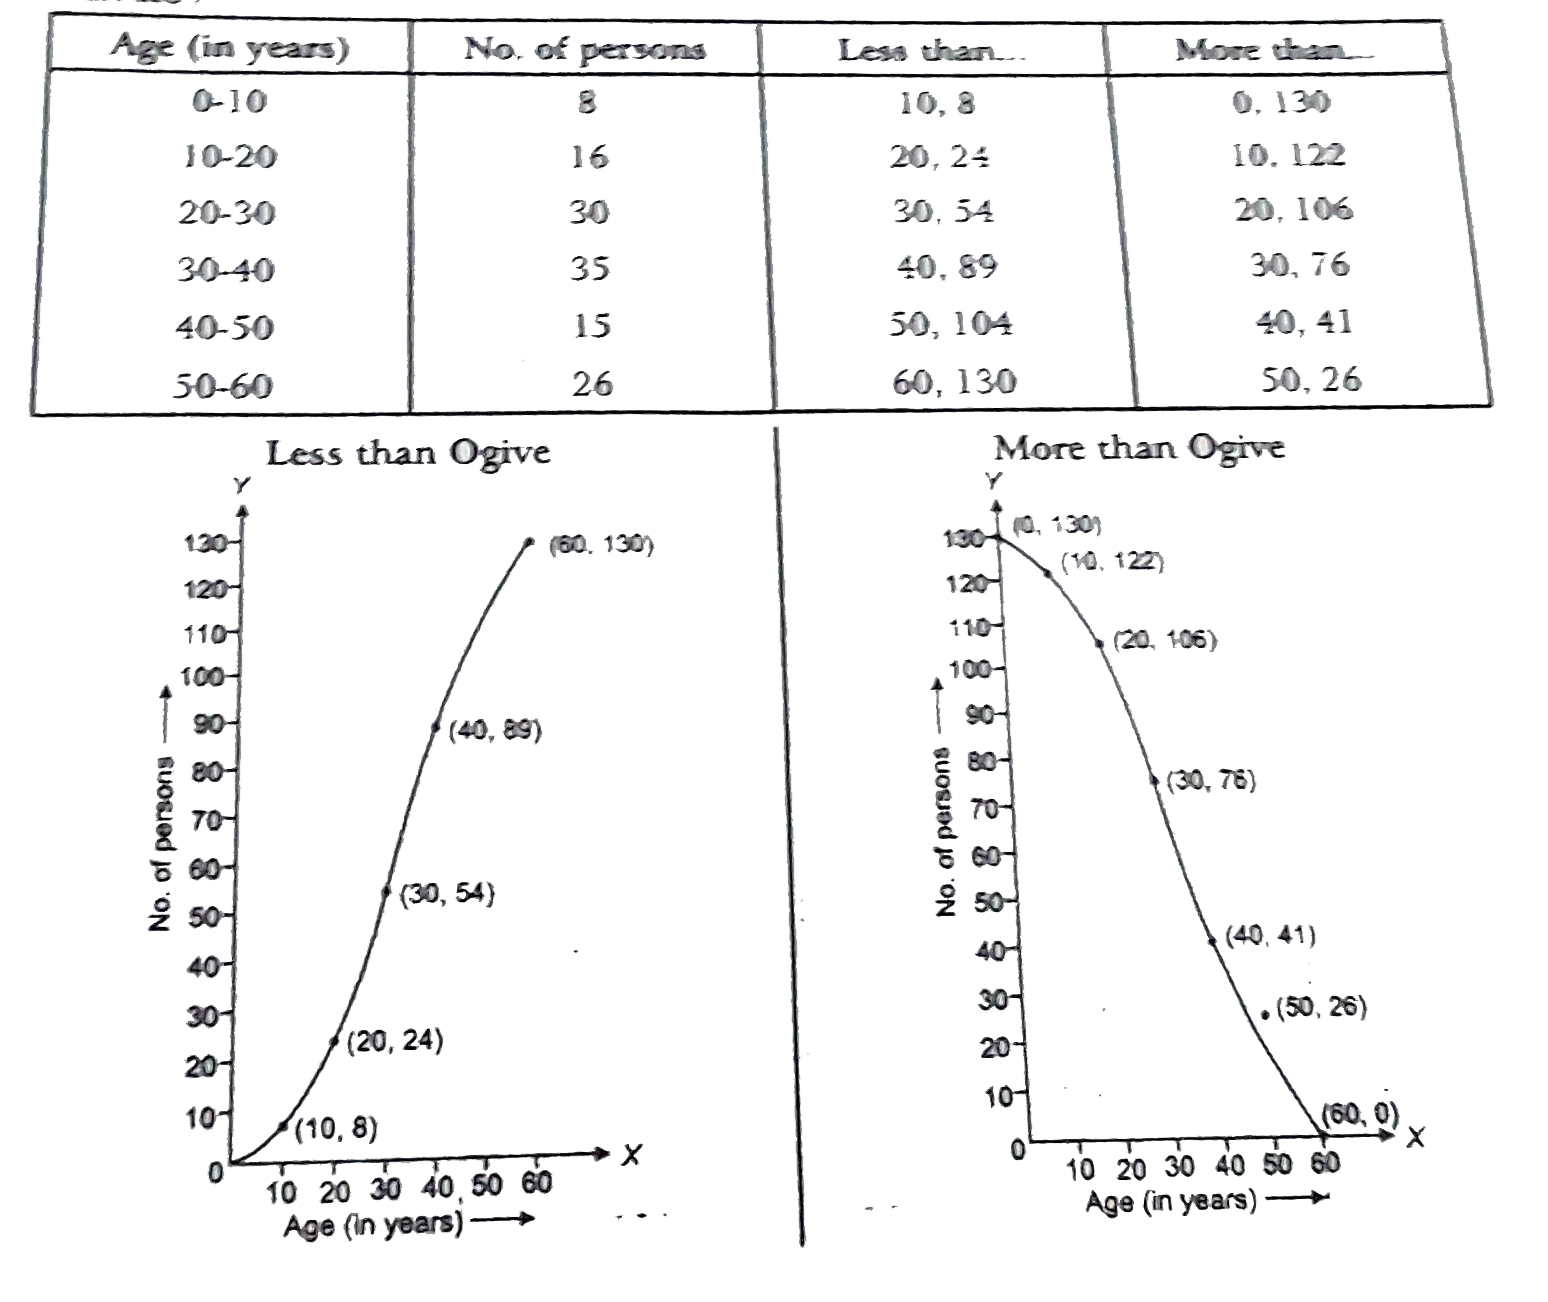
Construct a less than ogive and a more than ogive from the following data :

Cumulative frequency distribution table according to ages ( in years) less than and more than are :

Topper's Solved these Questions
- STATISTICS BOOK - NAGEEN PRAKASHAN ENGLISHCHAPTER - STATISTICS EXERCISE - Problems From NCERT/exemplar
4 Videos
- STATISTICS BOOK - NAGEEN PRAKASHAN ENGLISHCHAPTER - STATISTICS EXERCISE - Exercise 14 A
17 Videos
- SOME APPLICATIONS OF TRIGONOMETRYBOOK - NAGEEN PRAKASHAN ENGLISHCHAPTER - SOME APPLICATIONS OF TRIGONOMETRYEXERCISE - Long Answer Questions
5 Videos
- TRIANGLES BOOK - NAGEEN PRAKASHAN ENGLISHCHAPTER - TRIANGLES EXERCISE - Revision Exercise Long Questions
1 Video
Similar Questions
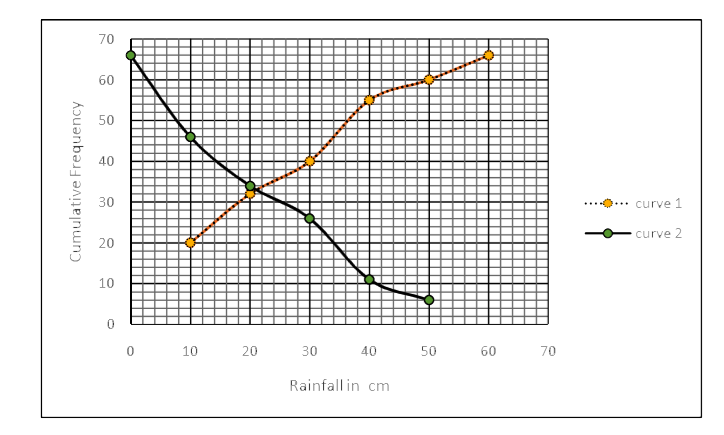
A TV reporter was given a task to prepare a report on the rainfall of the city Dispur of India in a particular year. After collecting the data, he analyzed the data and prepared a report on the rainfall of the city. Using this report, he drew the following graph for a particular time period of 66 days

Based on the above graph, answer the following questions
(i) Identify less than type ogive and more than type ogive from the given graph.
(ii) Find the median rainfall of Dispur
(iii) Obtain the Mode of the data if mean rainfall is 23.4cm
View SolutionDraw less than and more than ogive on the same graph and estimate median :

View Solution
Knowledge Check
The abscissa of the point of intersection of less than type and more than type ogives gives its
AmeanBmodeCmedianDall the three measures
For a given data with 70 observations the less then ogive and the more than ogive intersect at (20.5,35). The median of the data is
(a)20
(b) 35
(c) 70
(d) 20.5
View SolutionConstruct a composite index number, as a weighted mean from the following data:

View SolutionDraw a less than cumuative frequency curve (ogive) for the following distribution :

View SolutionConstruct a frequency table from the following data
MarksNo of studentsless than106less than2015less than3030less than4039less than5053les than6070
View SolutionDraw an ogive by less than method for the following data: No. of rooms: 1 2 3 4 5 6 7 8 9 10 No. of houses: 4 9 22 28 24 12 8 6 5 2
View SolutionDraw a 'less than' give for the following frequency distribution :

View SolutionFor the following data, draw a 'less than' ogive and hence find the median of the distribution.

View Solution