Draw the graph of the equation 2x+y=6 . Shade the region bounded by the graph and the coordinate axes. Also, find the area of the shaded region.
To solve the problem step by step, we will follow these instructions:
Step 1: Write the equation
The given equation is:
2x+y=6
Step 2: Find the intercepts
To draw the graph, we need to find the x-intercept and y-intercept.
Finding the y-intercept:
Set x=0 in the equation:
2(0)+y=6⟹y=6
So, the y-intercept is (0,6).
Finding the x-intercept:
Set y=0 in the equation:
2x+0=6⟹2x=6⟹x=3
So, the x-intercept is (3,0).
Step 3: Plot the points
Now we have two points to plot:
1. A(0,6)
2. B(3,0)
Step 4: Draw the graph
On a graph paper:
- Draw the x-axis and y-axis.
- Mark the points A(0,6) and B(3,0).
- Draw a straight line through these two points, which represents the equation 2x+y=6.
Step 5: Shade the region
Shade the area bounded by the line and the coordinate axes. This shaded area forms a right triangle.
Step 6: Find the area of the shaded region
The area A of a triangle is given by the formula:
A=12×base×height
In this case:
- The base is the x-intercept, which is 3 units.
- The height is the y-intercept, which is 6 units.
Substituting these values into the area formula:
A=12×3×6=182=9 square units
Final Answer
The area of the shaded region is 9 square units.
---
The given equation is:
2x+y=6
To draw the graph, we need to find the x-intercept and y-intercept.
Set x=0 in the equation:
2(0)+y=6⟹y=6
So, the y-intercept is (0,6).
Set y=0 in the equation:
2x+0=6⟹2x=6⟹x=3
So, the x-intercept is (3,0).
Now we have two points to plot:
1. A(0,6)
2. B(3,0)
On a graph paper:
- Draw the x-axis and y-axis.
- Mark the points A(0,6) and B(3,0).
- Draw a straight line through these two points, which represents the equation 2x+y=6.
Shade the area bounded by the line and the coordinate axes. This shaded area forms a right triangle.
The area A of a triangle is given by the formula:
A=12×base×height
In this case:
- The base is the x-intercept, which is 3 units.
- The height is the y-intercept, which is 6 units.
A=12×3×6=182=9 square units
The area of the shaded region is 9 square units.
Topper's Solved these Questions
Similar Questions
Knowledge Check
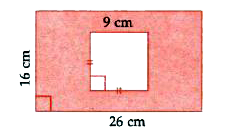
In the joining figure , find the area of the shaded region.
 A325cm2B245cm2C335cm2D185cm2
Draw the graphs of 2x+y=6andx−y+2=0. Shade the region boun-ded by these lines and x=axis. Find the area of the shaded region.
View SolutionDraw the graphs of 2x+y=6 and 2x−y+2=0 . Shade the region bounded by these lines and x-axis. Find the area of the shaded region.
View SolutionDraw the graphs of the equations x−y=1 and 2x+y=8 . Shade the area bounded by these two lines and y-axis. Also, determine this area.
View SolutionDraw the graph of the equation x3+y4=1. Also, find the area of the triangle formed by the line and the coordinates axes.
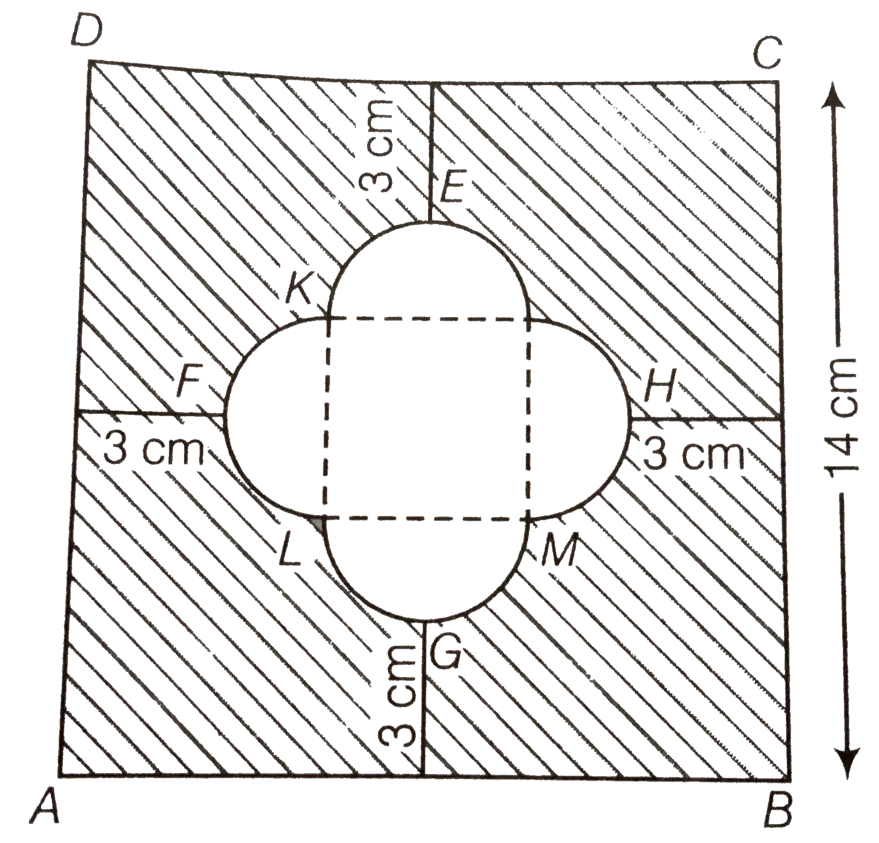
View SolutionFind the area of the shaded region given in figure.

View SolutionIn the given figure, find the area of the shaded region [Useπ=3.14]
View SolutionIn figure, find the area of the shaded region [Useπ=3.14]
View Solution

