Draw the graph of the exponential funcation.
(i) f(x)=2x (ii) f(x)=(13)x
Video Solution
Text Solution
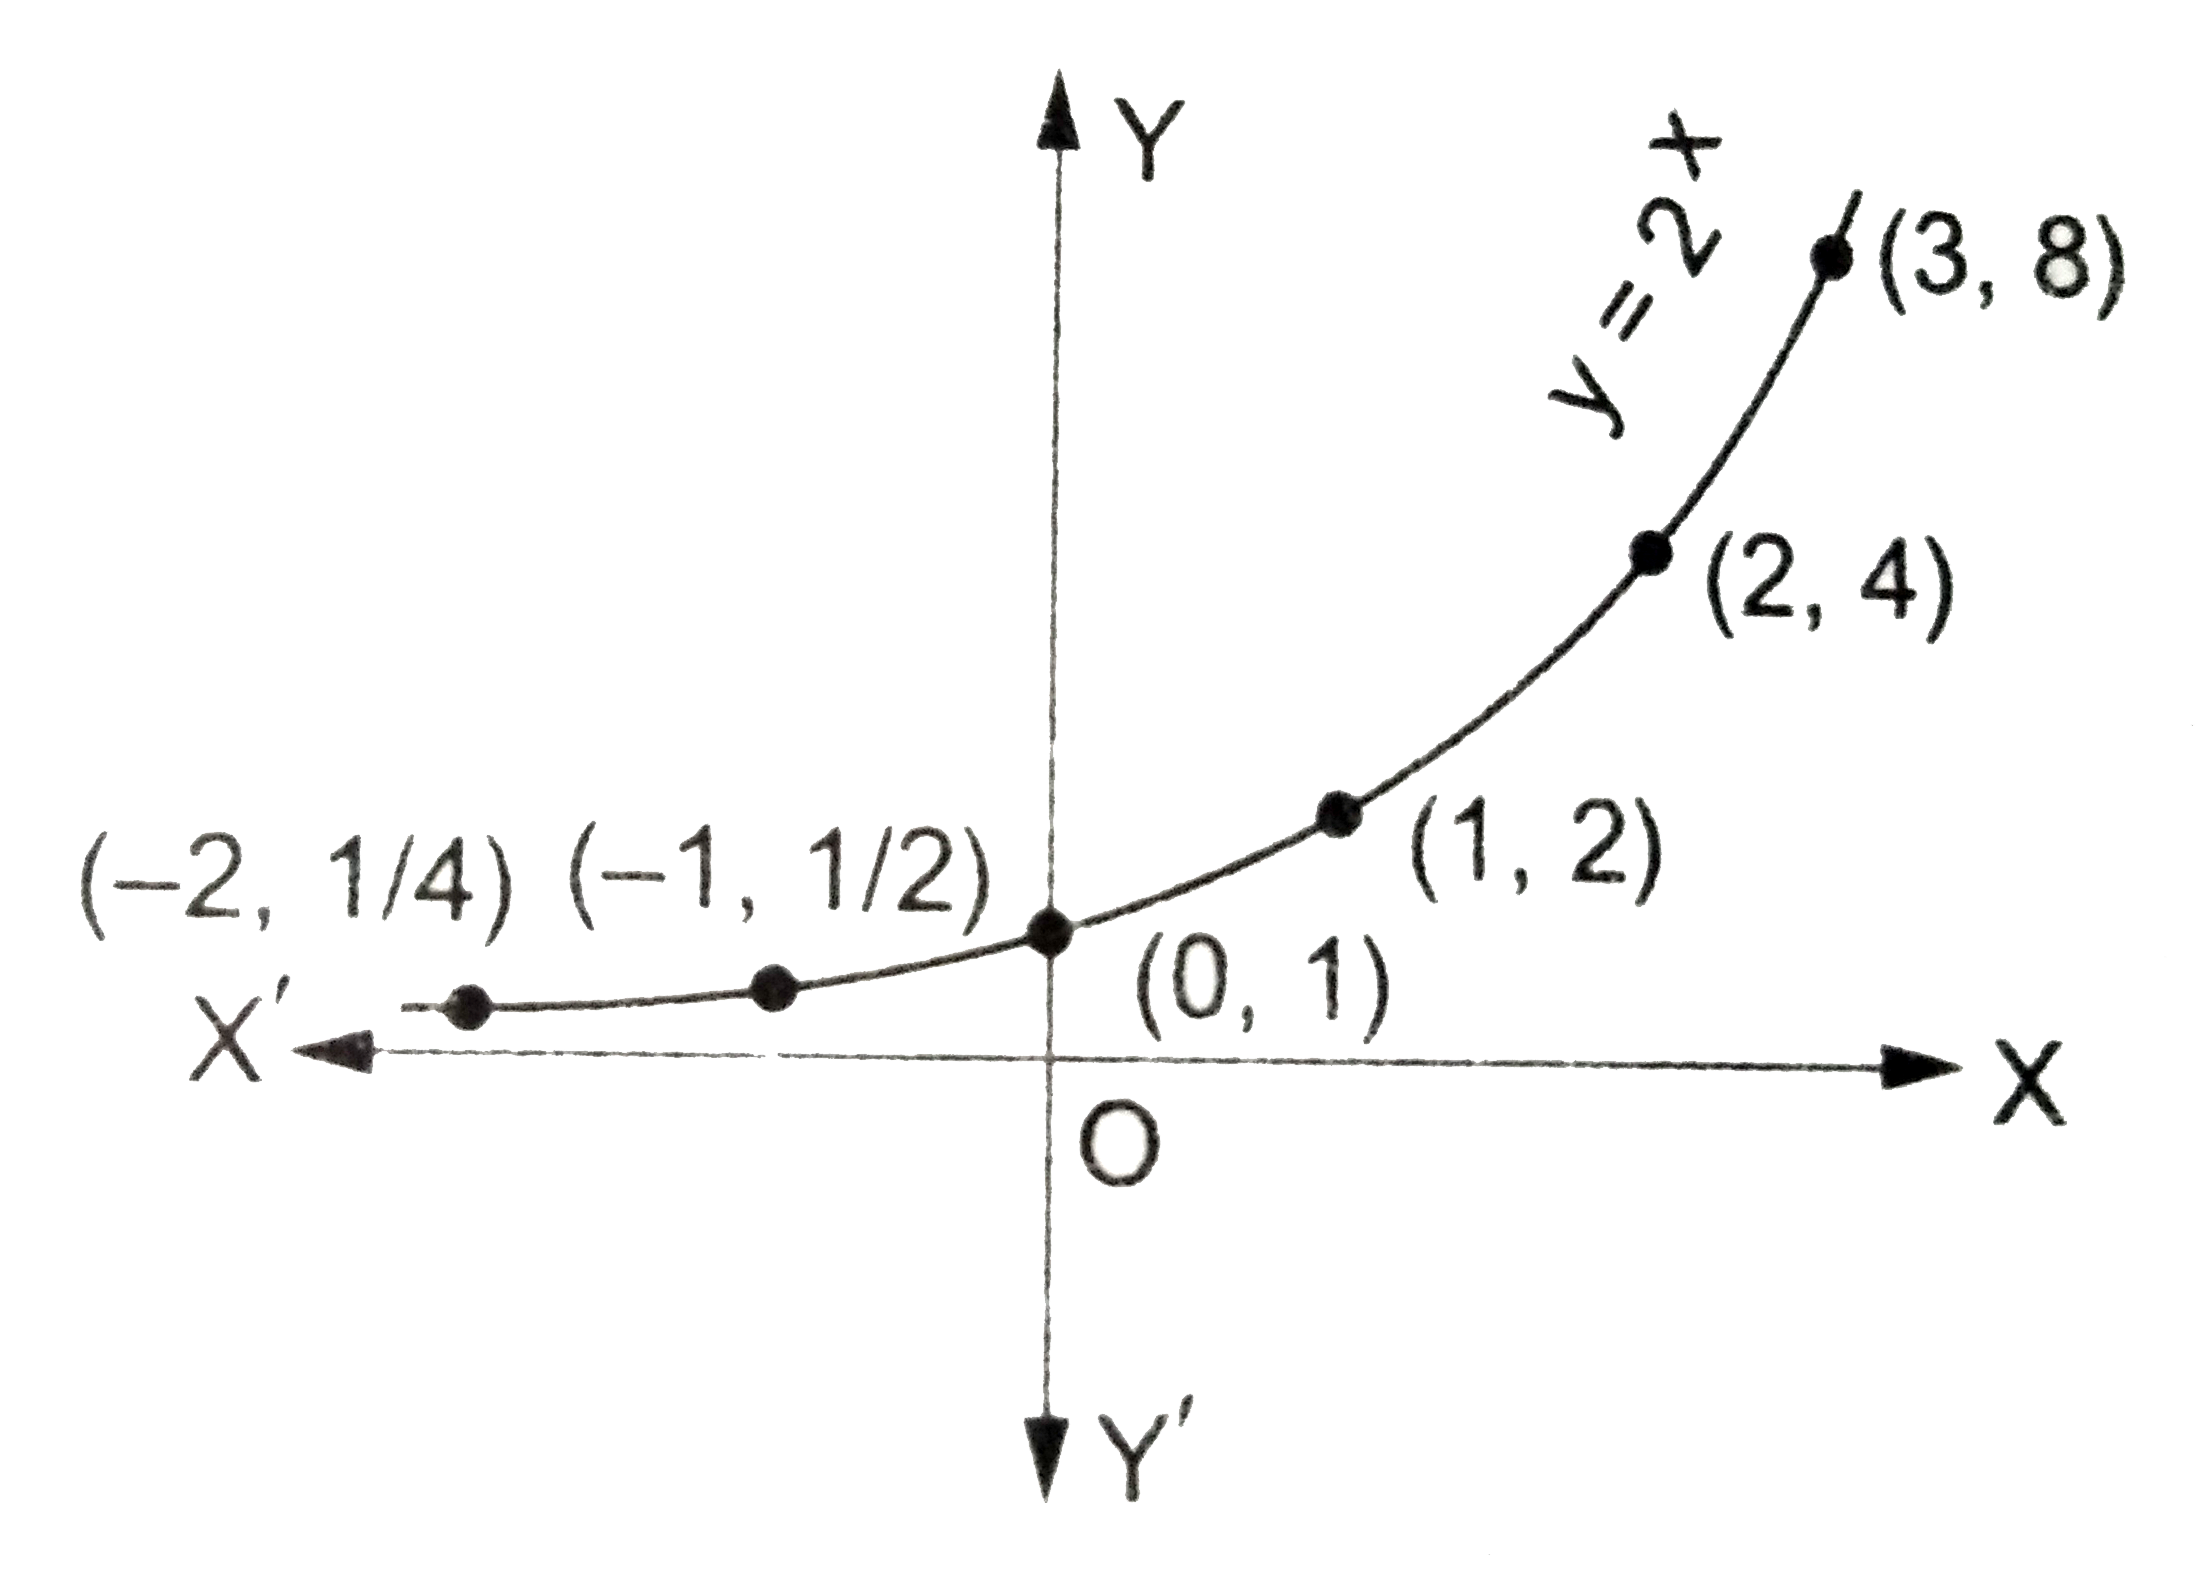
(i) f(x)=2x
Some of the points on the graph are
(0,1) , (1,2) , (2,4),(3,8) , (−1,12),(−2,14),(−3,18) etc.
And so the graph takes the form, shown in the adjoining figure.
It may be observed here that the given funcation is strictly increasing. Also, as the value of x decrease, the corresponding value of the funcation descreases, and therefore, on the left-hand side of the y -axis , the curve comes closer and closer to the x-axis.
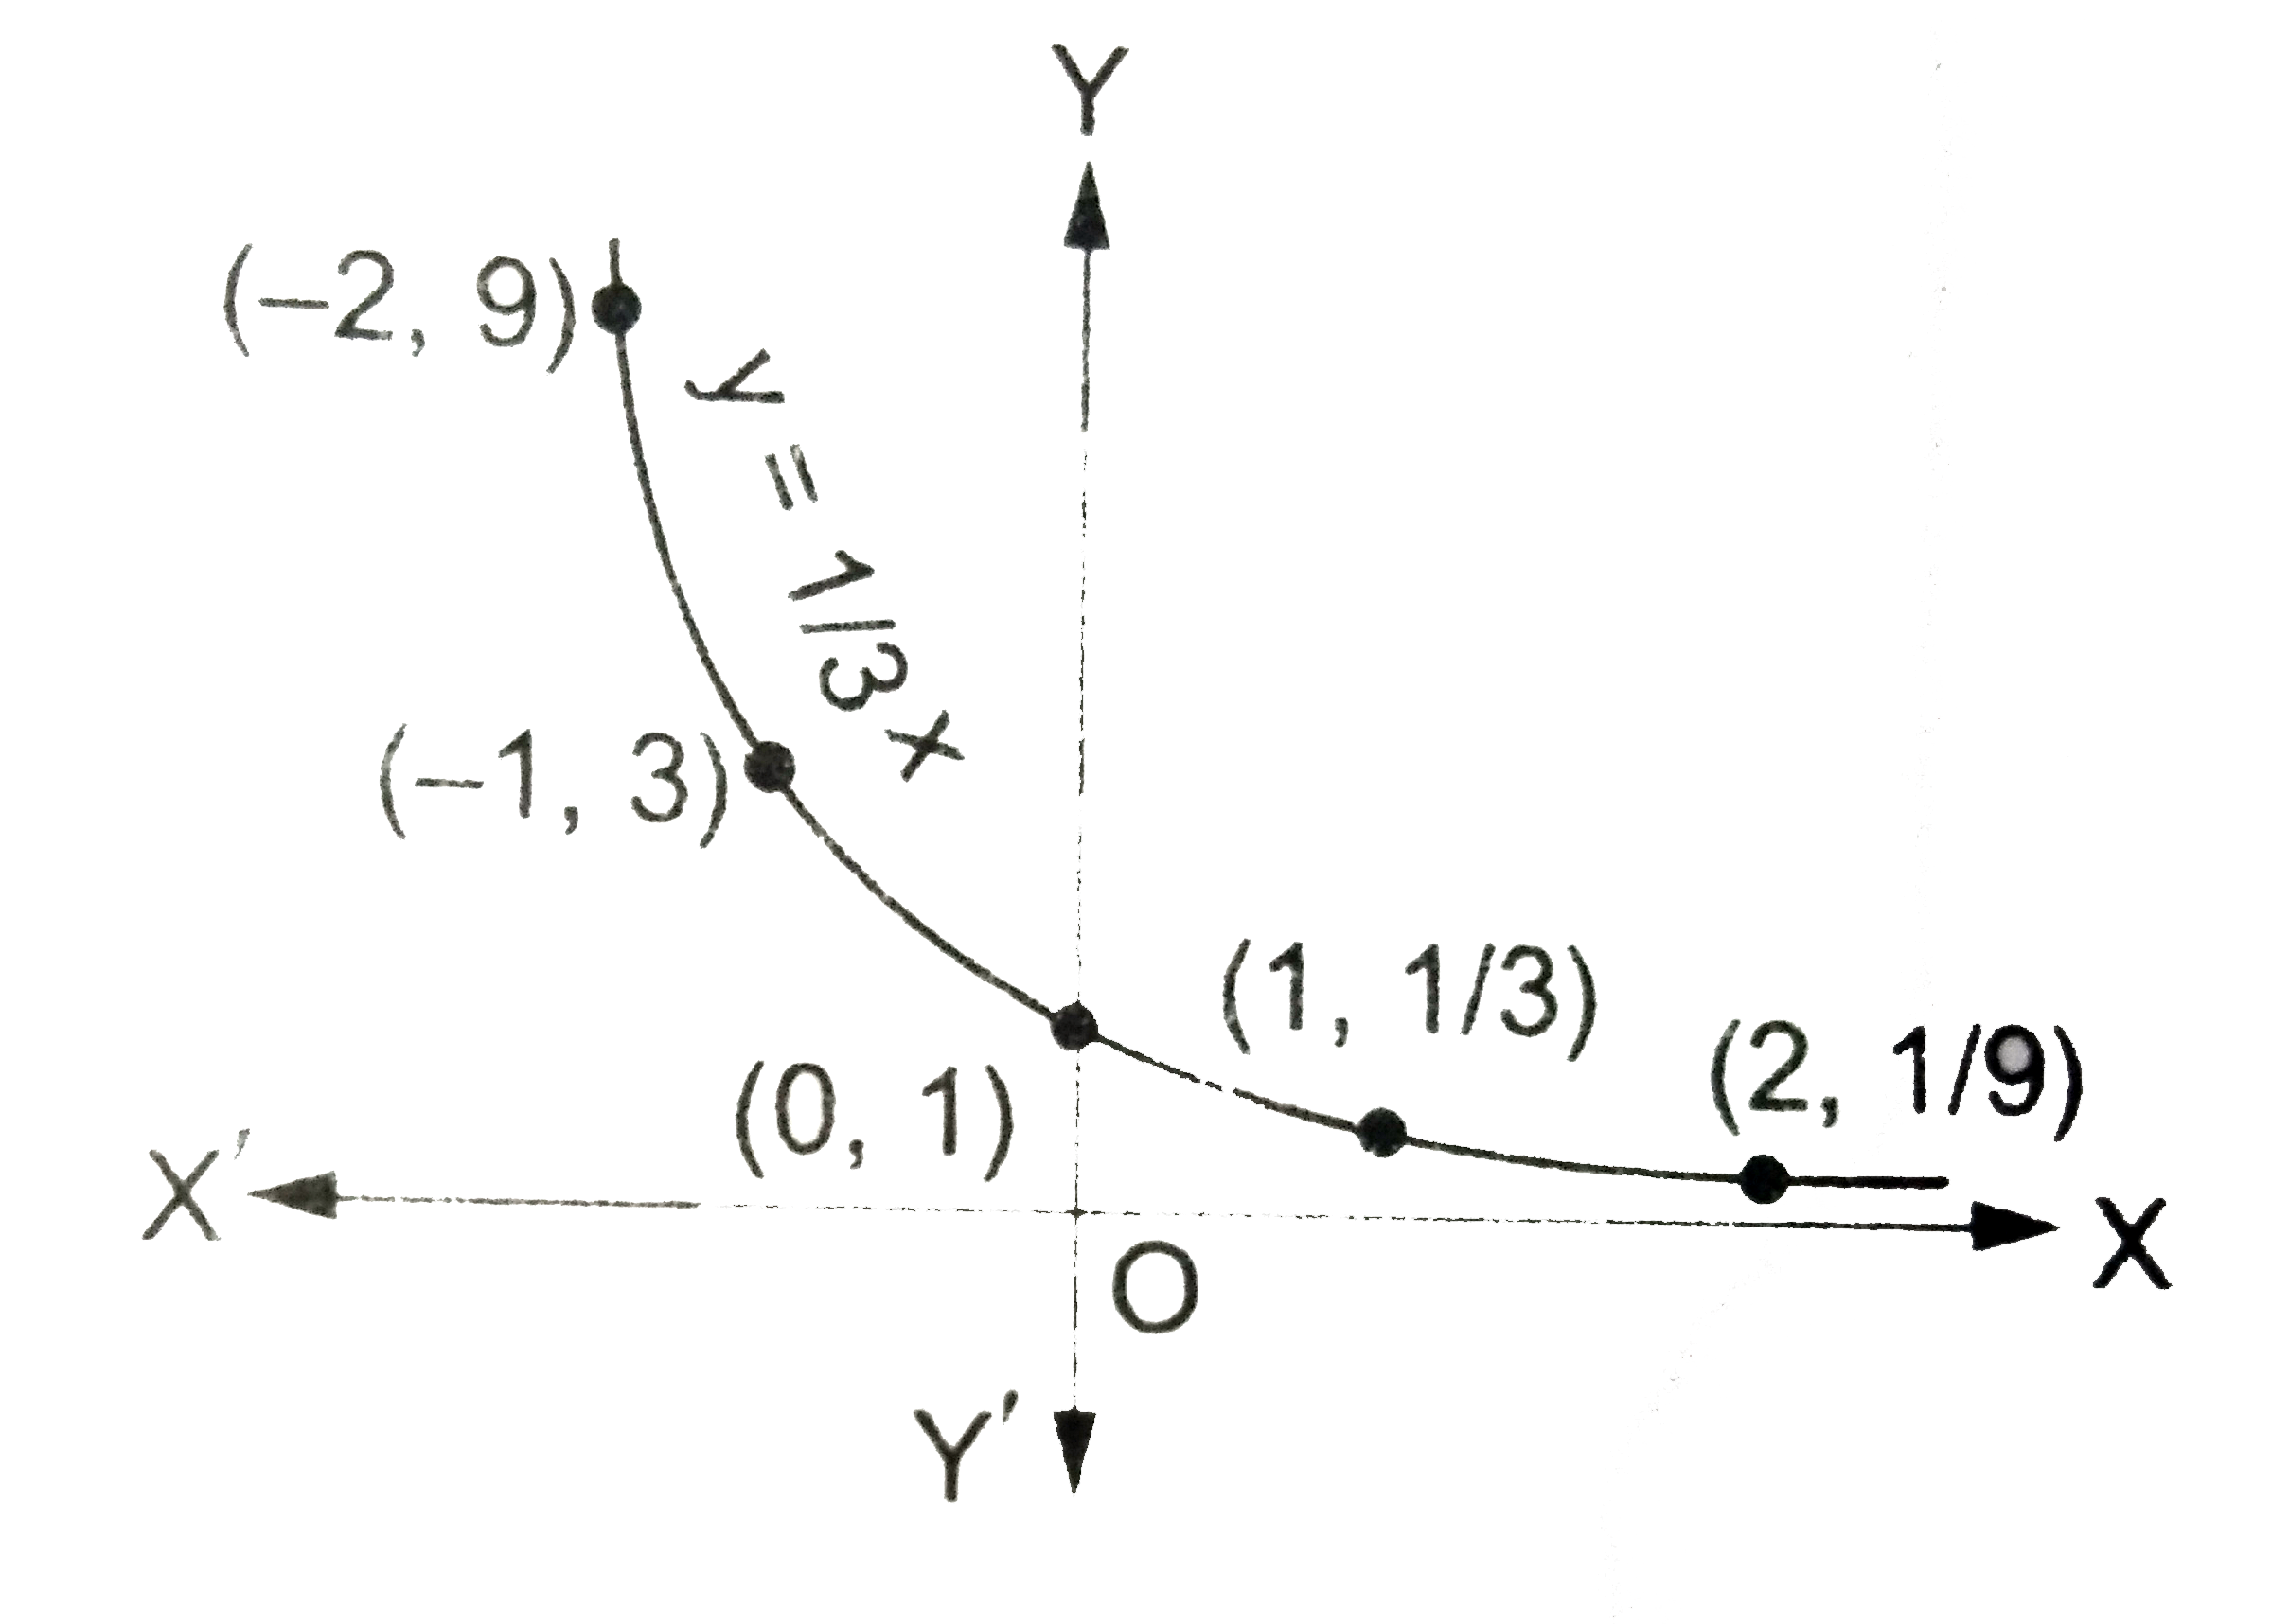
(ii) Let f(x)=(13)3=13x
some of the points on the graph are ( -2,9)
(−1,3),(0,1)(1,13),(2,19) , etc.
Joining these, points, we obtain the graph as shown. if follows the graph the given funcation is strictly decreasing .
On the RHS of the y-axis. the curve comes closer and closer to the x-axis.


|
Topper's Solved these Questions
- CONTINUITY AND DIFFERENTIABILITYBOOK - RS AGGARWALCHAPTER - CONTINUITY AND DIFFERENTIABILITYEXERCISE - Exercise 9A
27 Videos
- CONTINUITY AND DIFFERENTIABILITYBOOK - RS AGGARWALCHAPTER - CONTINUITY AND DIFFERENTIABILITYEXERCISE - Exercise 9B
11 Videos
- BINARY OPERATIONSBOOK - RS AGGARWALCHAPTER - BINARY OPERATIONSEXERCISE - Exercise 3B
8 Videos
- CROSS,OR VECTOR, PRODUCT OF VECTORSBOOK - RS AGGARWALCHAPTER - CROSS,OR VECTOR, PRODUCT OF VECTORSEXERCISE - Exercise 24
26 Videos
Similar Questions
Draw the graph of the reciprocal function f(x)=1x
View SolutionDraw the graph of the following function.
f(2x)
View SolutionDraw the graph of the following function.
2f(x)
View SolutionDraw the graphs of the polynomial funcations
(i) f(x)=x2 (ii) f(x)=1−x2
(iii) f(x)=x3−x
View SolutionDraw the graph of the step funcation f (x) = [ x ].
View SolutionDraw the graphs of the linear funcations (i) f (x) = 1 -x (ii) f(x) = 2x+1
View SolutionDraw the graph of the rational function f(x)=x2−1x−1
View SolutionDraw the graph of the polynomial f(x)=x3 .
View SolutionDraw the graph of the function f(x)=(1x)x
View SolutionDraw the graph of the function: f(x)=log|x|
View Solution
