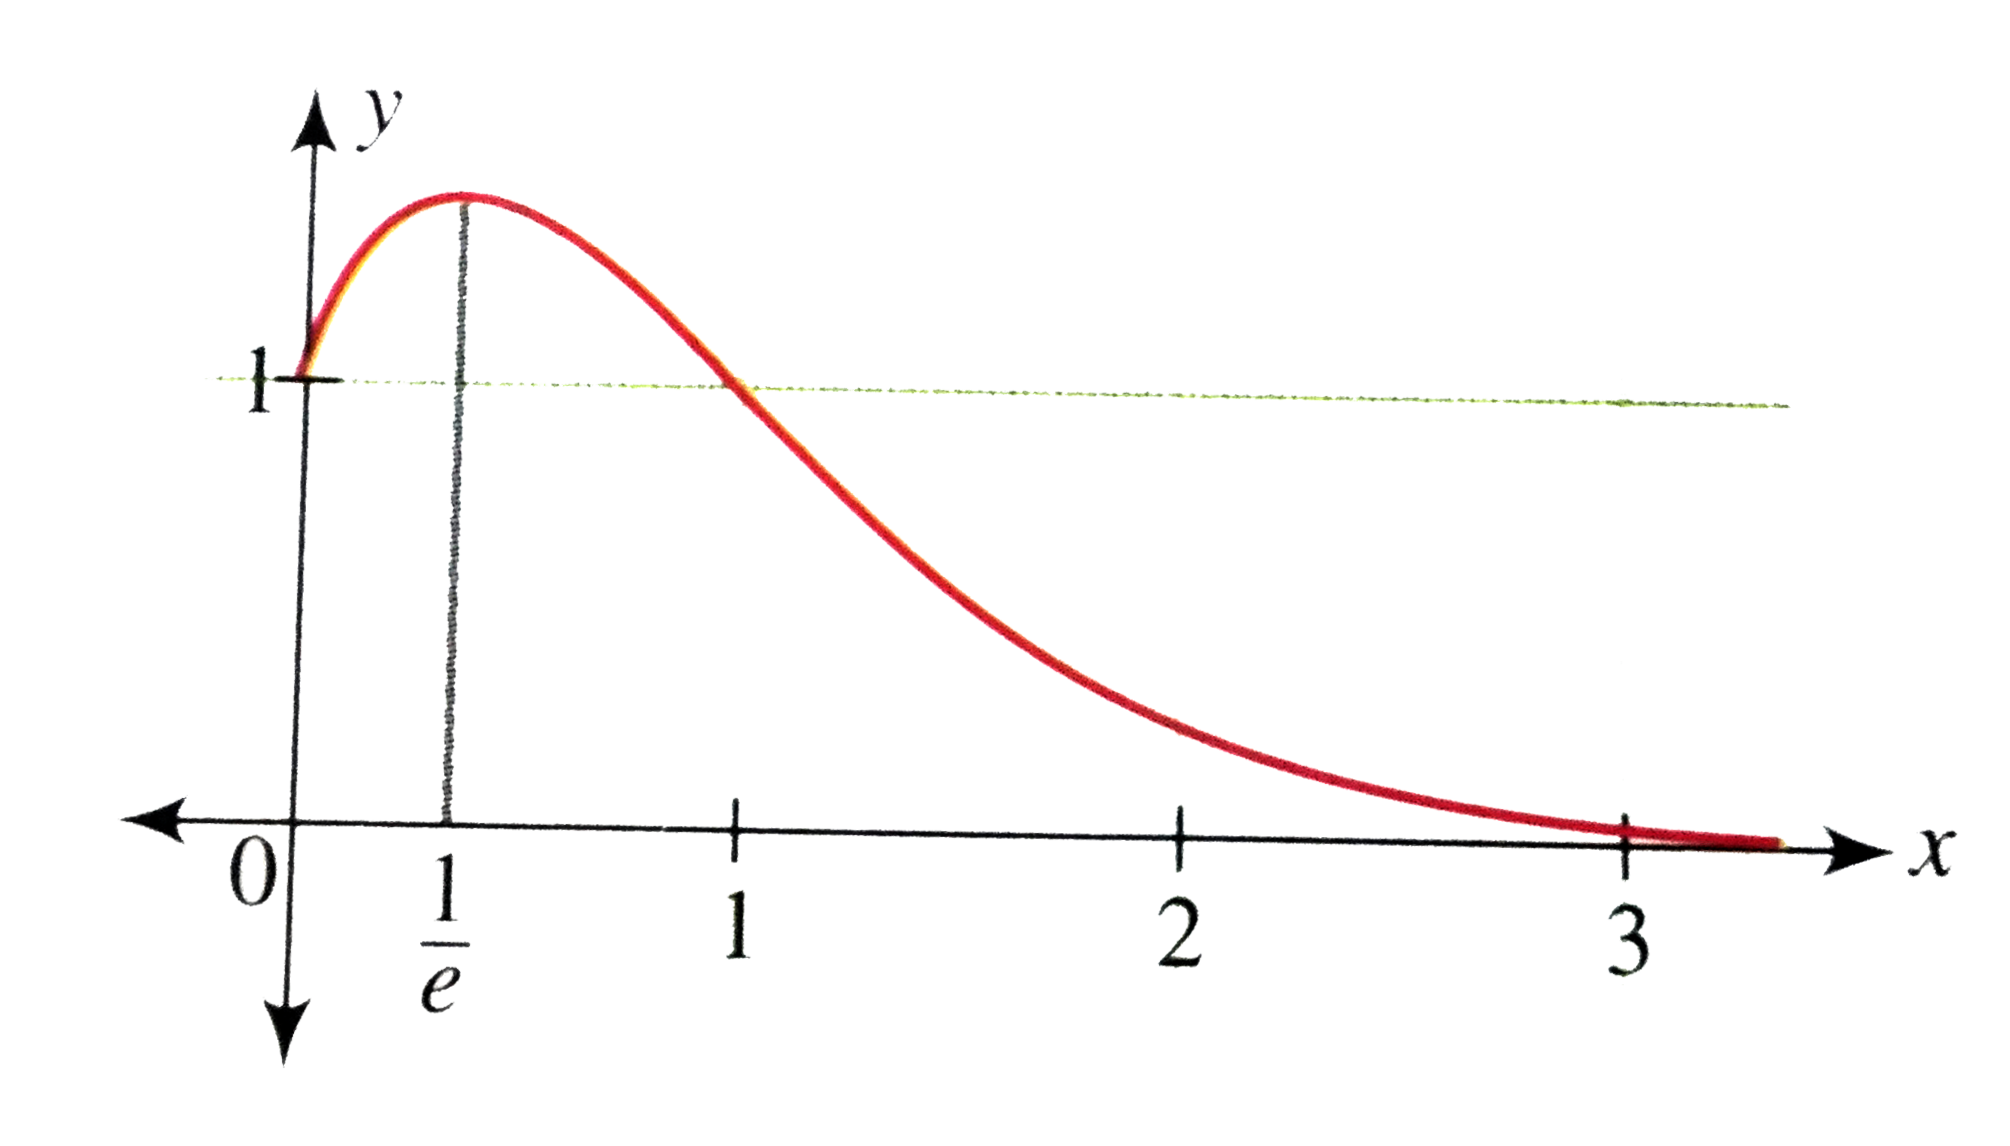
Draw the graph of the function f(x)=(1x)x
Text Solution
We have f(x)=(1x)x
Clearly, domain of the function is x>0
Differentiating we get, f′(x)=(1x)x(log1x−1)
f′(x)=0⇒log1x=1=logee⇒1x=e⇒x=1e
Also for x<1/e,f′(x) is positive and for x>1/e,f′(x) is negative.
Therefore, the maximum value of the function is e1/e.
Also, limx→0(1x)x=elimx→0xlog(1x)=e-limx→0xlogx=e−x→0limlogx1x=e−x→0lim1x−1x2=e0=1
limx→∞(1x)x=0
From the above discussion, the graph of the function is as shown in the following figure.

|
Topper's Solved these Questions
Similar Questions
Draw the graph of the function f(x)=(1+1x)2
View SolutionDraw the graph of the function f(x)=(1+1x)2
View SolutionDraw the graph of the function f(x)=|x−1|
View SolutionDraw the graph of the function f(x)=xx
View SolutionDraw the graph of the function f(x)=xx
View SolutionDraw the graph of the function f(x)=∣∣∣(x+12)[x]∣∣∣,−2≤x≤2, where [⋅] denotes the greatest integer function. Find the points of discontinuity and non-differentiability.
View SolutionDraw the graph of the function f(x)=−x|x|.
View SolutionDraw the graph of the function: |f(x)|=tanx
View SolutionDraw the graph of the function: f(x)=log|x|
View SolutionDraw the graph of the function: f(x)=log|x|
View Solution
