Draw the graph of y=f(x)=x+1x2+1Solution in Bengali
Video Solution
Text Solution
y=f(x)=x2−x+1x2+x+1
The domain of the function is R as x2+x+1=0 has no real roots.
1. y-intercept
f(0)=1
So the graph cuts the y-axis at (0,1).
2. x-intercept (zeros)
Put y=0 or x2−x+1=0.
This equation has no real roots.
Hence the graph does not intersect the x-axis.
3. Asymptotes
Vertical asymptotes
Since x2+x+1=0 had no real roots, the graph has no vertical asymptote.
Horizontal asymptotes
Since the degree of the numerator and that of the denominator are same, the horizontal asymptote is
y=limx→±∞x2−x+1x2+x+1
or y=limx→±∞1−1x+1x21+1x+1x2 or y=1
Clearly, the graph has no ablique asymptote.
4. Extremum
f'(x)=2(x2−1)(x2+x+1)2
f'(x)=0⇒x=±1
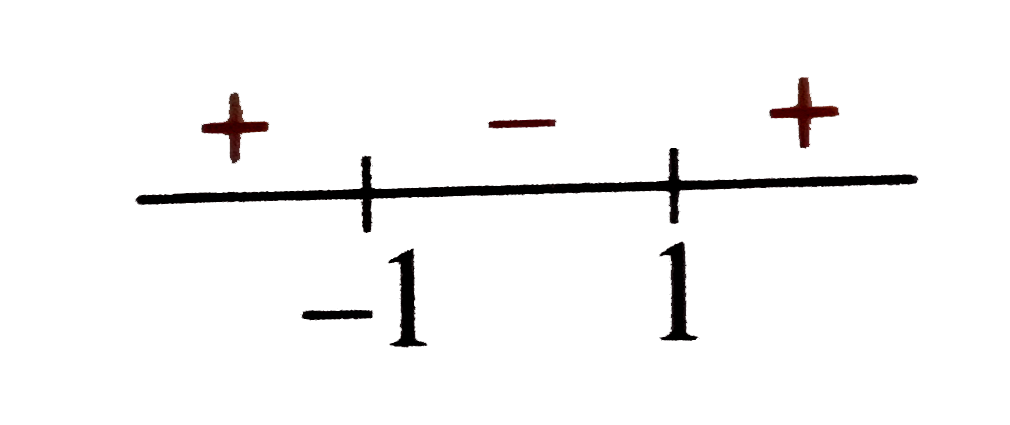
Sign scheme of f'(x) is as follows.

From the sign scheme, x = 1 is the point of minima and x = -1 is the point of maxima.
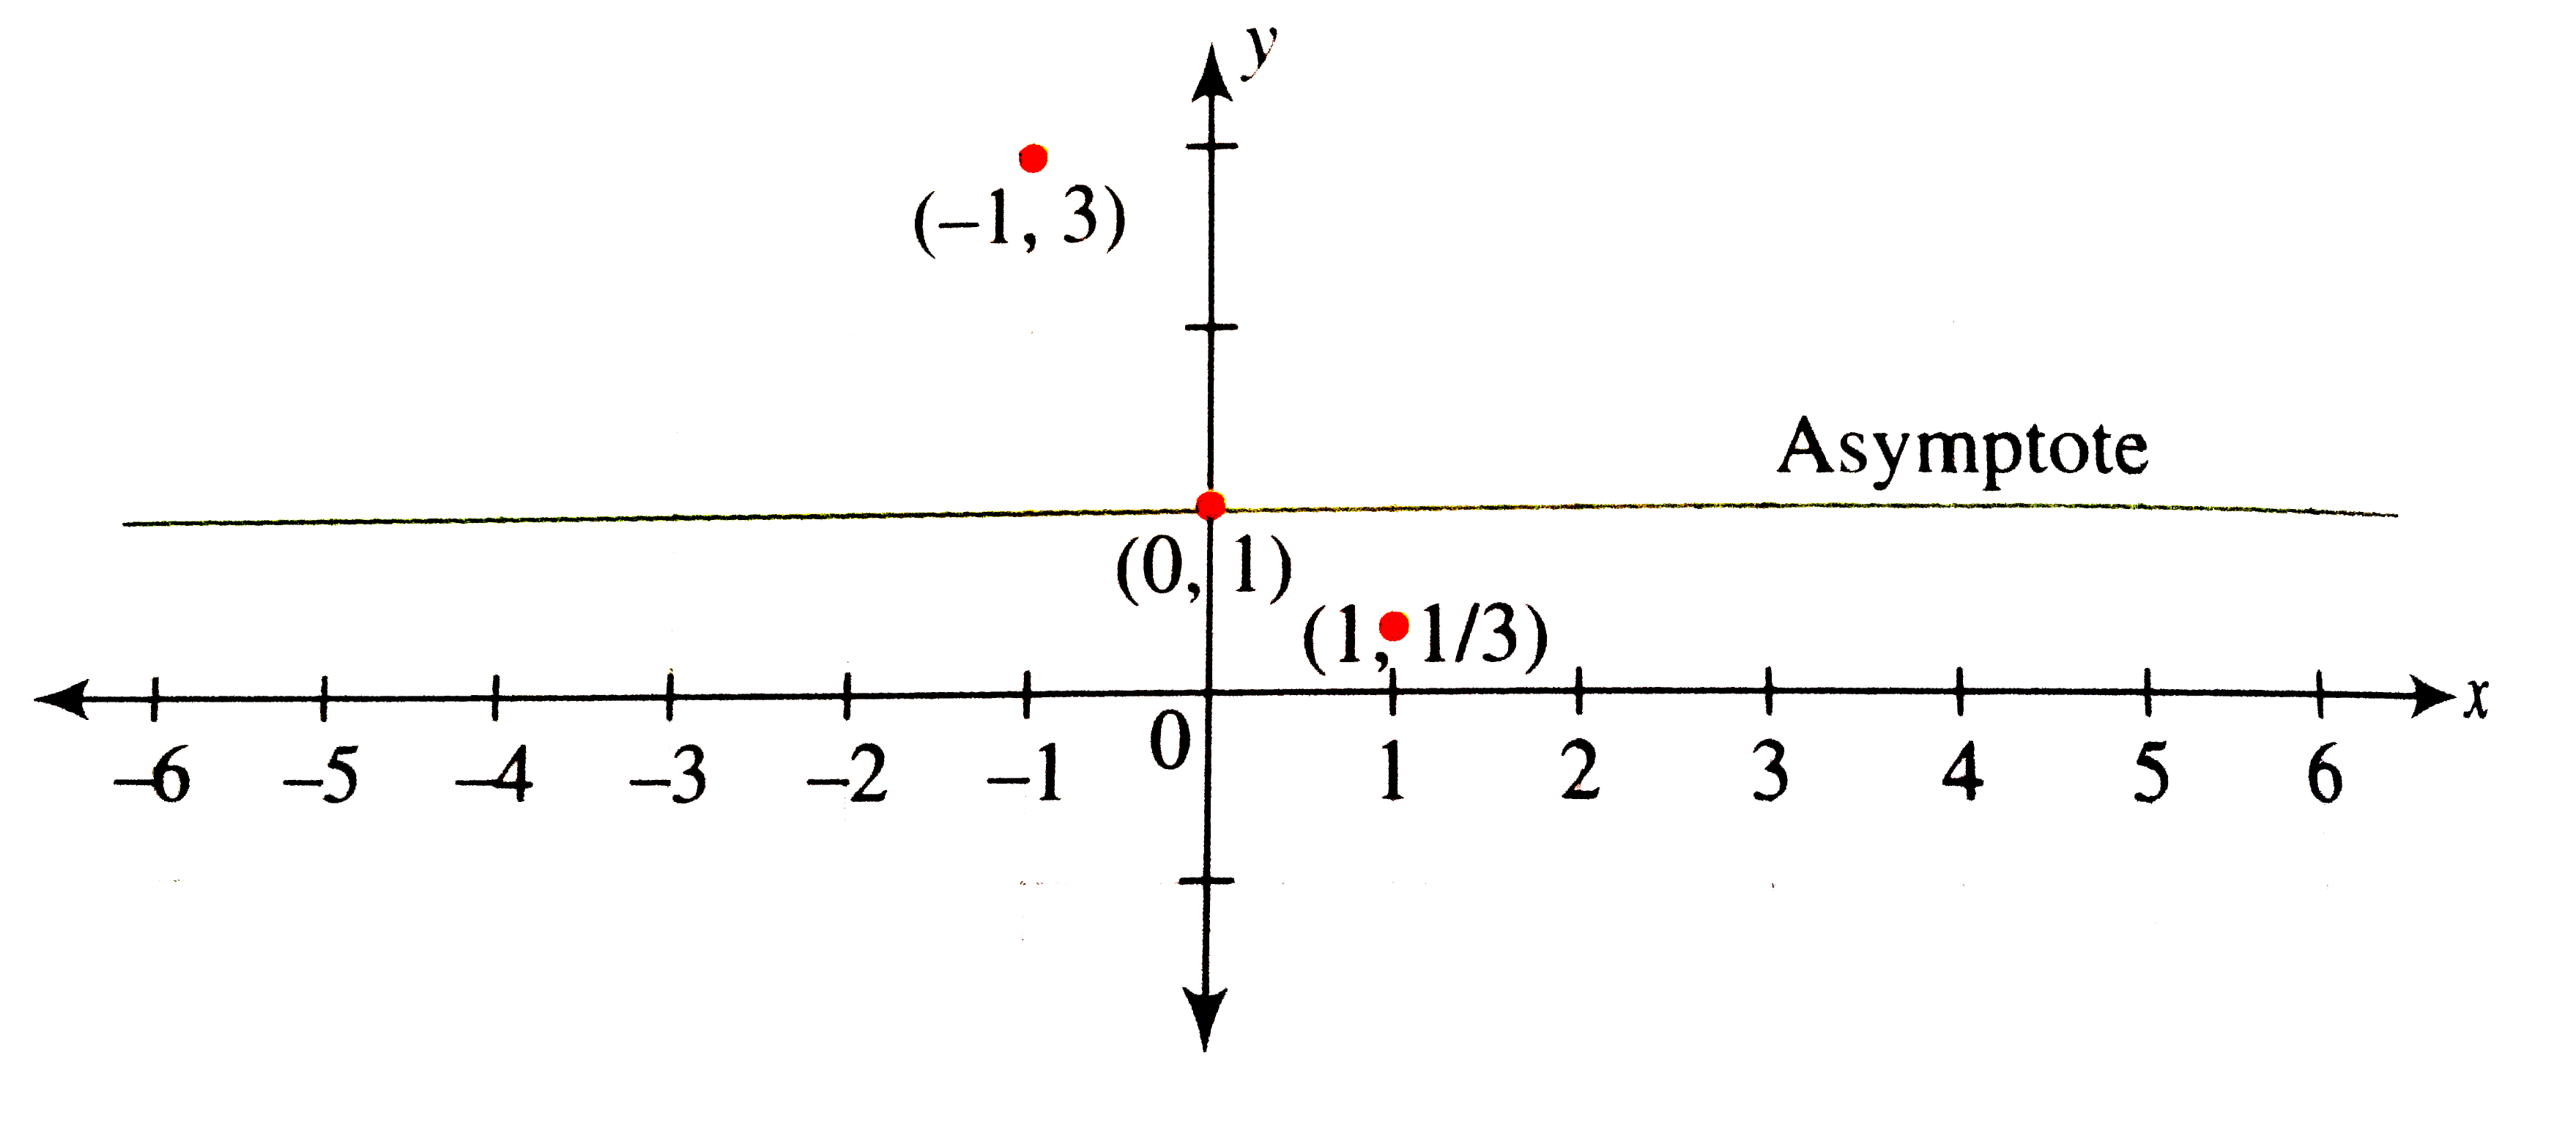
Also f(1)=13 and f(−1)=3,f(0)=1.
From the above discussion, we have the following reference points and lines.

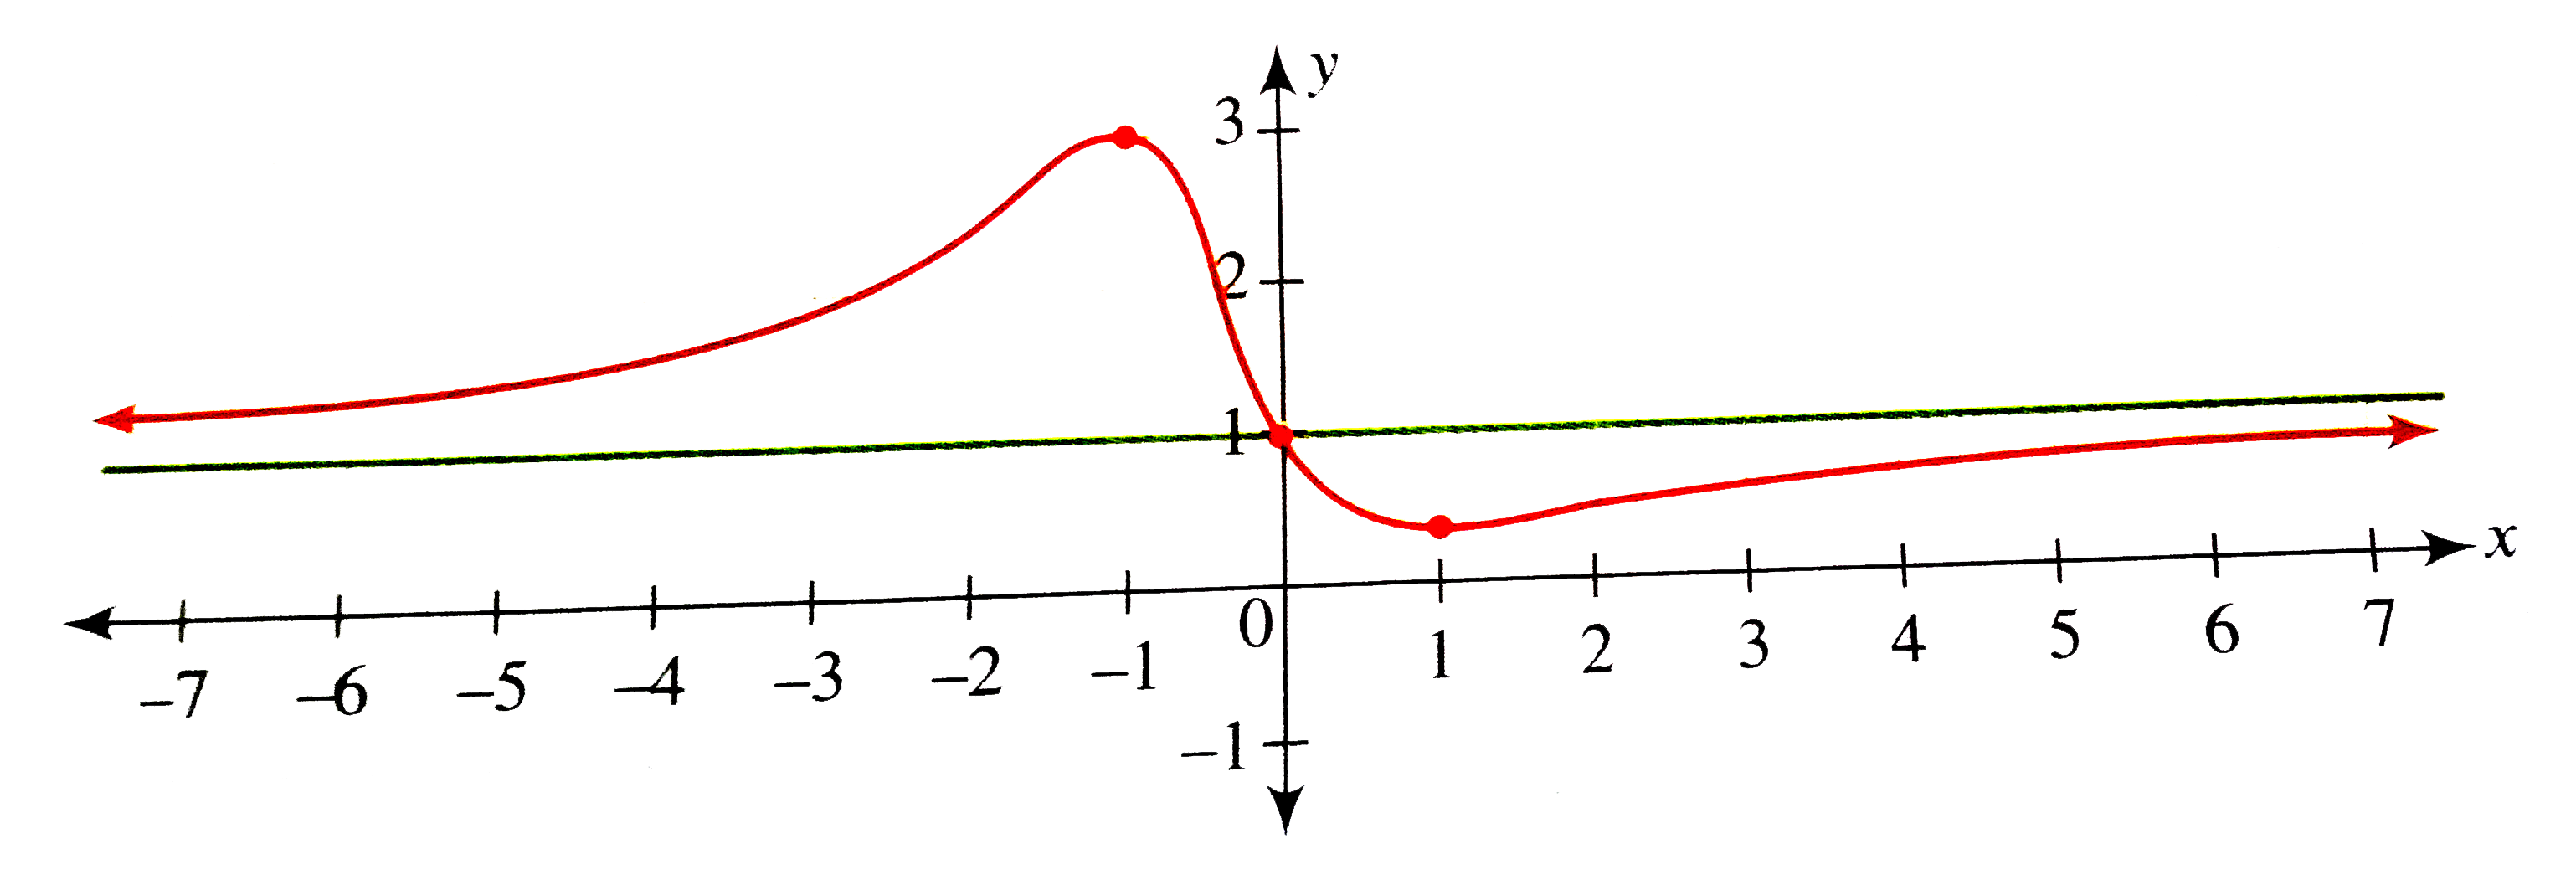
When x→∞,y→1 and in (−∞,−1),f(x) increases from '1' to '3'.
At x=−1,f(x) attains the maximum value '3'.
In (−1,1),f(x) decreases from '3' to '1/3' intersecting the y-axis at (0, 1) and attains minima at x = 1.
In (1,∞),f(x) increases from '1/3' to '1' and finally approaches to asymptote y = 1 when x→∞,y→1.
Thus , the graph of y=f(x) is as shown in the following figure.

|
Topper's Solved these Questions
- GRAPHS OF POLYNOMIAL AND RATIONAL FUNCTIONSBOOK - CENGAGE PUBLICATIONCHAPTER - GRAPHS OF POLYNOMIAL AND RATIONAL FUNCTIONSEXERCISE - Exercises
17 Videos
- GRAPHICAL TRANSFORMATIONSBOOK - CENGAGE PUBLICATIONCHAPTER - GRAPHICAL TRANSFORMATIONSEXERCISE - ILLUSTRATION
78 Videos
- GRAPHS OF ELEMENTARY FUNCTIONS BOOK - CENGAGE PUBLICATIONCHAPTER - GRAPHS OF ELEMENTARY FUNCTIONS EXERCISE - EXERCISES
34 Videos
Similar Questions
Draw the graph of y=(x−1)(x2−x+1).
View SolutionPlot y=|x|,y+x−2∣,andy=|x|2∣
View SolutionDraw the graph of y=1(1/x).
View SolutionDraw the graph of y=x−1x2 and hence the graph of y=|x−1|x2.
View SolutionDraw the graph of y=f(x)=x+1x2+1
View SolutionDraw the graph of y=f(x)=x2x2+1.
View SolutionDraw the graph of y=x−1x−2.
View SolutionDraw the graph of the function y=f(x)=tan−1(1−x21+x2).
View SolutionDraw the graph of y=x−1x2 and hence the graph of y=|x−1|x2.
View SolutionDraw the graph of y=f(x)=x+1x2+1
View SolutionDraw the graph of y=f(x)=x2x2+1.
View SolutionDraw the graph of f(x)=2|x−1|x2+1.
View SolutionDraw the graph of y=x−1x−2.
View SolutionDraw the graph of the function y=f(x)=tan−1(1−x21+x2).
View SolutionDraw the graph of y=f(x)=(x+1)/(x^(2)+1)
View SolutionDraw the graph of y=f(x)=(x^(2))/(x^(2)+1) .
View Solution
