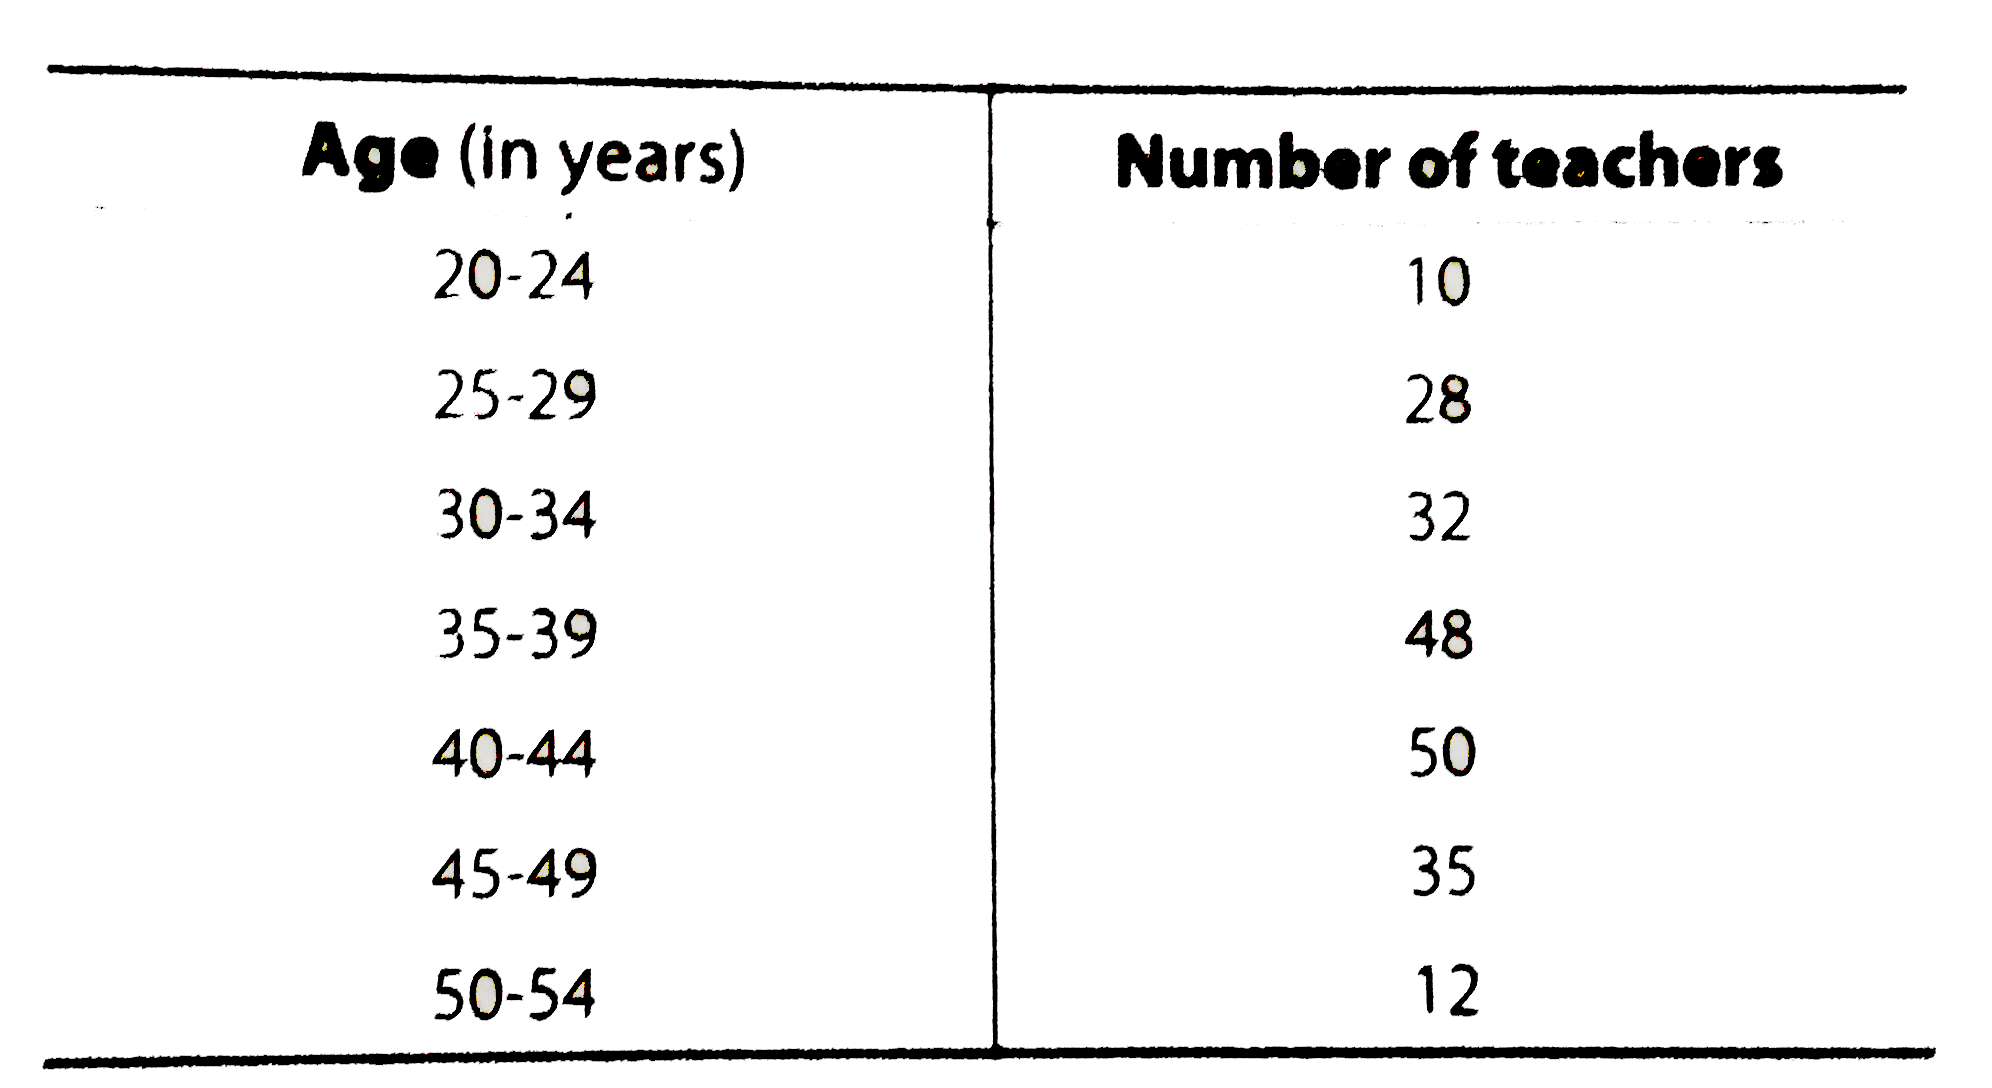
Draw the histogram to represent the following data.

Step by step video & image solution for Draw the histogram to represent the following data. by Maths experts to help you in doubts & scoring excellent marks in Class 10 exams.
Topper's Solved these Questions
- BOOK - NAVNEET PUBLICATION - MAHARASHTRA BOARDCHAPTER - STATISTICSEXERCISE - EXAMPLES3videos
STATISTICS
- BOOK - NAVNEET PUBLICATION - MAHARASHTRA BOARDCHAPTER - STATISTICSEXERCISE - MISCELLANEOUS24videos
STATISTICS
- BOOK - NAVNEET PUBLICATION - MAHARASHTRA BOARDCHAPTER - STATISTICSEXERCISE - Assignment 6.34videos
STATISTICS
- BOOK - NAVNEET PUBLICATION - MAHARASHTRA BOARDCHAPTER - SIMILARITYEXERCISE - SUBJECTIVE TYPE20videos
SIMILARITY
- BOOK - NAVNEET PUBLICATION - MAHARASHTRA BOARDCHAPTER - THEOREMS EXERCISE - CIRCLE15videos
THEOREMS
Similar Questions
Draw a histogram to represent the following data.
 View Solution
Draw a histogram to represent the following:
 View Solution
Draw a histogram to represent the following data: Monthly salary (in Rs.), Number of teachers 5600-5700 5700-5800 5800-5900 5900-6000 6000-6100 6100-6200 6200-6300 6300-6400, 8 4 3 5 2 3 1 2
View SolutionDraw a histogram to represent the following grouped frequency distribution.
 View Solution
In a class of 40 students, the marks obtained (out of 50) are as given below:

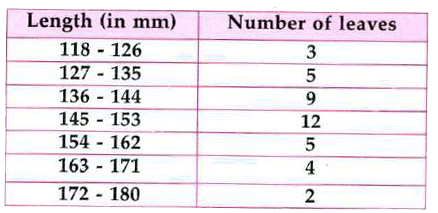
Draw a histogram to represent the given data.View SolutionThe length of 40 leaves of a plant are measured correct to one millimetre, and the obtained data is represented in the following table:

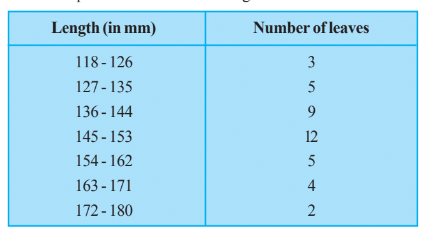
Draw a histogram to represent the given data. [Hint: First make the class intervals continuous]View SolutionThe length of 40 leaves of a plant are measured correct to one millimeter, and the obtained data is represented in the following table:

(i) Draw a histogram to represent the given data.
(ii) Is there any other suitable graphical representation for the same data?
(iii) Is it correct to conclude that the maximum number of leaves are 153 mm long?Why?View SolutionThe length of 40 leaves of a plant measured correct to one millimetre and the obtained data is represented in the following table:

(i) Draw a histogram to represent the given data.
(ii) Is there any other suitable graphical representation for the same data?
(iii) Is it correct to conclude that the maximum number of leaves 153 mm long and why?View SolutionThe given table presents the number of illiterate males in the age group (10-34) in a town.

Draw a histogram to represent the above data.View SolutionRepresent the following data by histogram:
 View Solution

