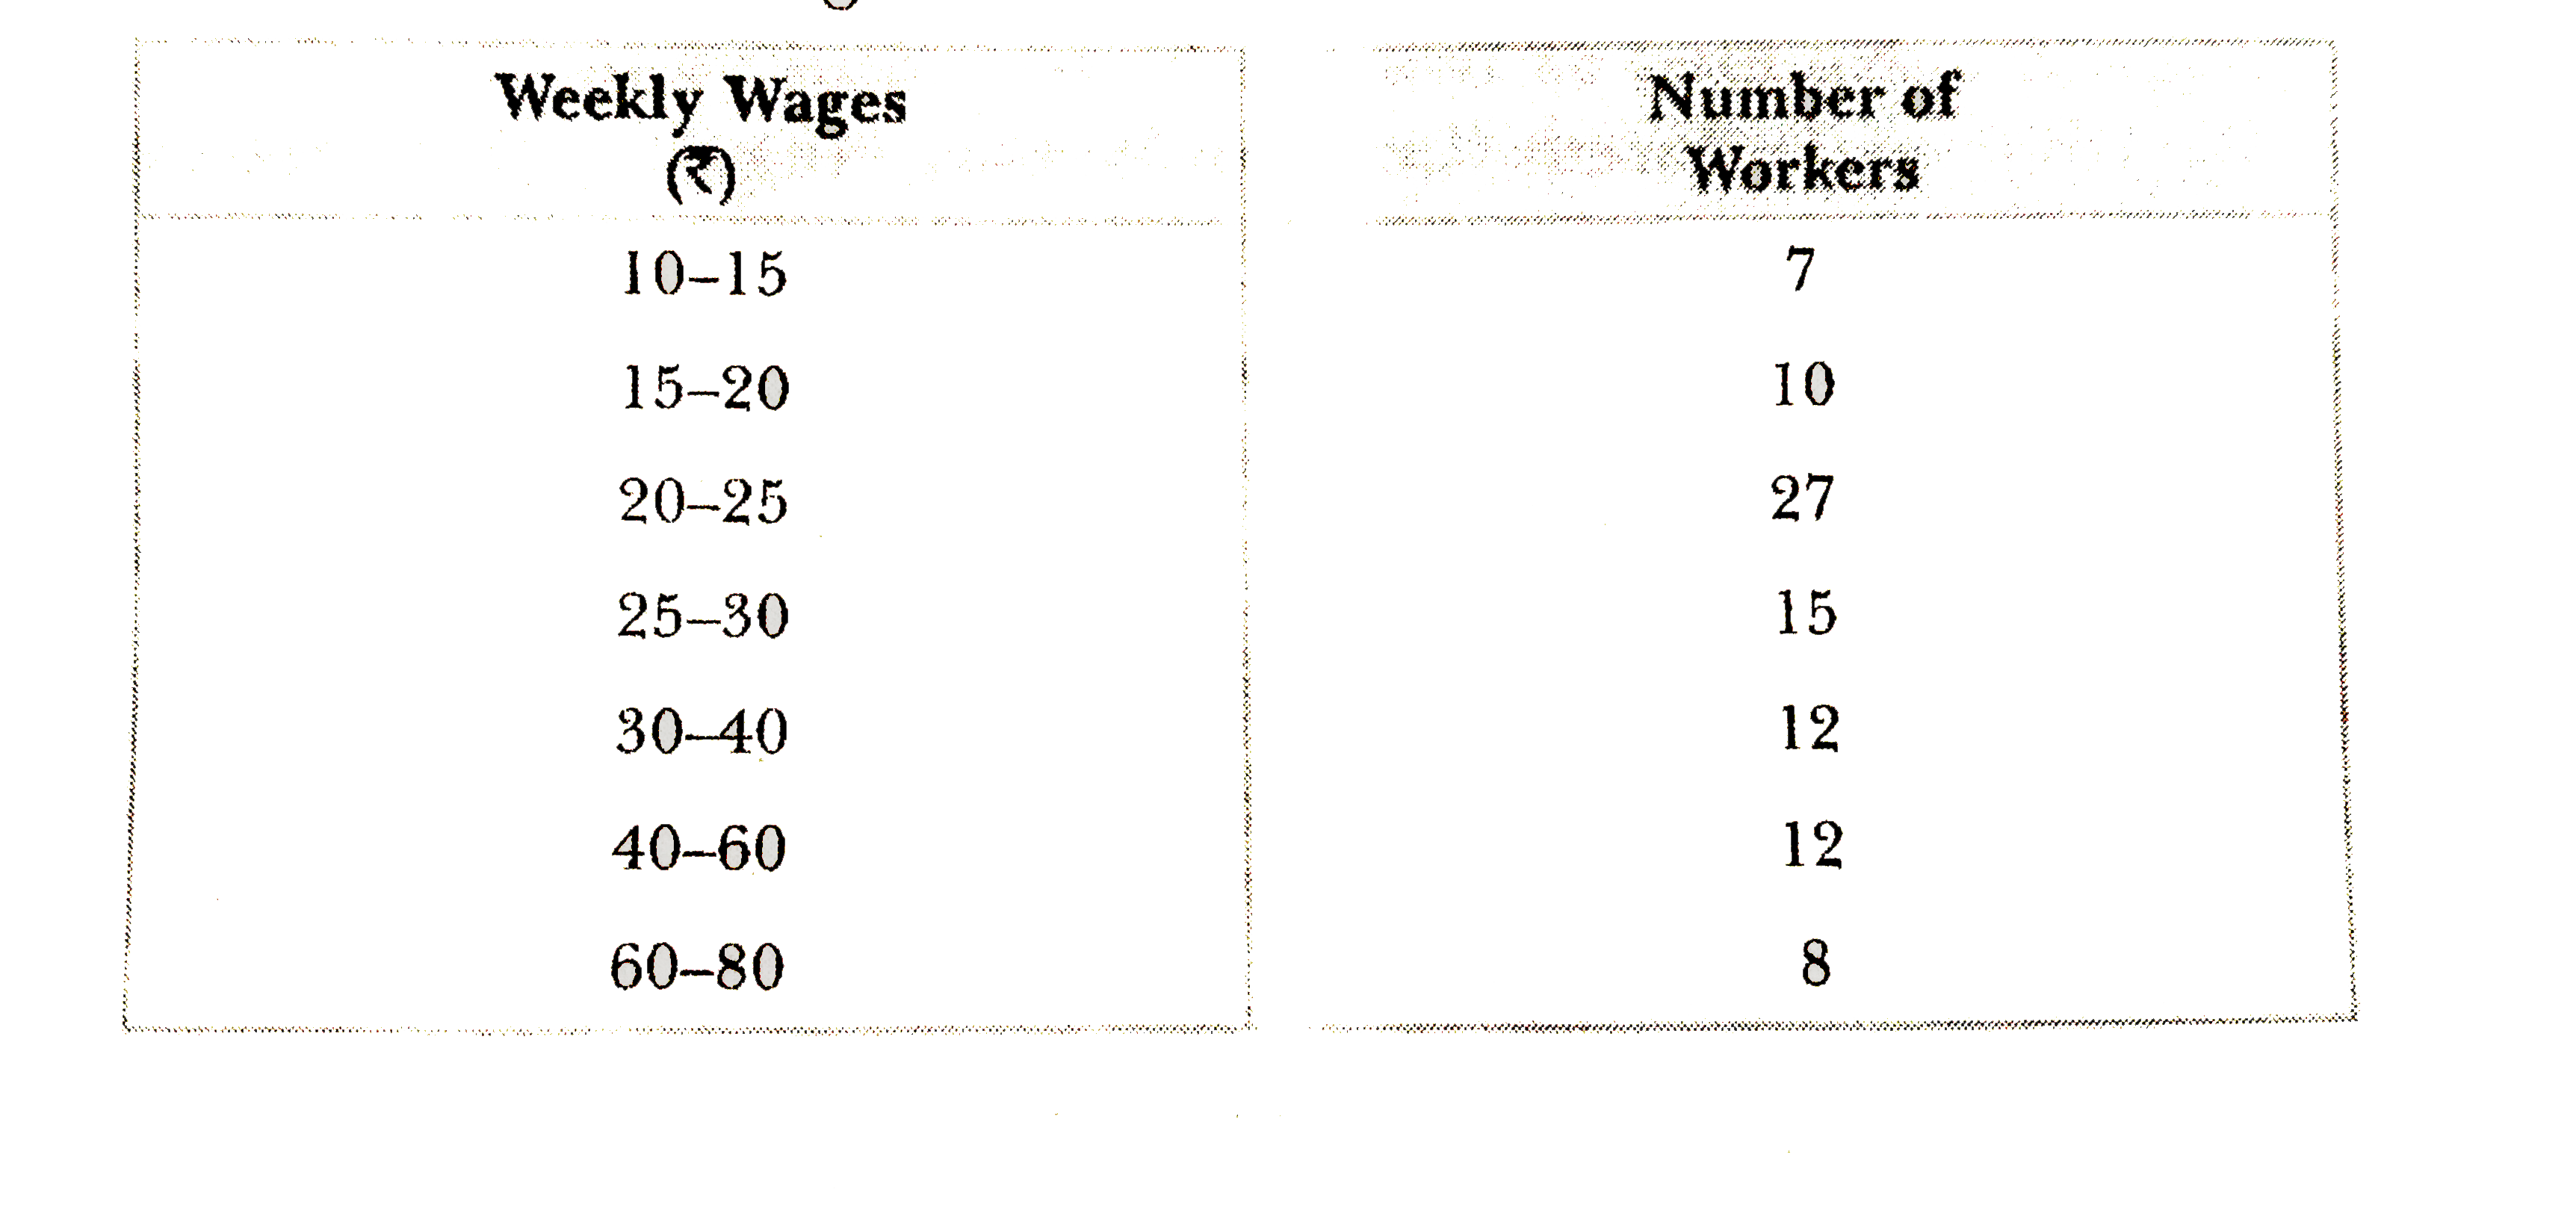
Represent the following data by histogram:

Step by step video & image solution for Represent the following data by histogram: by Maths experts to help you in doubts & scoring excellent marks in Class 10 exams.
Updated on:21/07/2023Topper's Solved these Questions
- STATISTICSBook:TARGET PUBLICATIONChapter:STATISTICSExercise:Apply your knowledge
Explore 5 Videos
- STATISTICSBook:TARGET PUBLICATIONChapter:STATISTICSExercise:Chapter Assessment
Explore 15 Videos
- STATISTICSBook:TARGET PUBLICATIONChapter:STATISTICSExercise:Multiple Choice Questions
Explore 14 Videos
- SIMILARITY Book:TARGET PUBLICATIONChapter:SIMILARITY Exercise:Chapter Assessment
Explore 19 Videos
- TRIGONOMETRY Book:TARGET PUBLICATIONChapter:TRIGONOMETRY Exercise:Chapter Assessment
Explore 18 Videos
Similar Questions
Represent the following data using a histogram.

View SolutionRepresent the following data by frequency curve :

View SolutionPresent the following data in the form of a histogram :

View SolutionPresent the following data in the form of a histogram :

View SolutionFor the following data, draw a histogram and a frequency polygon

View SolutionDraw a frequency polygon from the following data by using (i) histogram , and (ii) without using histogram :

View SolutionRepresent the following data, using a percentage bar diagram :

View SolutionDraw the histogram to represent the following data.

View SolutionDraw a histogram to represent the following data.

View SolutionDraw a frequency polygon to represent the following data.

View Solution
