Each month. The Bureau of Labor Statistics conducts a survey called the Current Population Survey (CPS) to measure unemployement in the United States. Across the country, about 60,000 households are included in the survey sample. These households are grouped by geographic region. A summery of the January 2014 survey results for make responds in one geographica region is shown in the table below.

Q. If one unemployed man from this sample is chosen at random for a follow-up survey, what is the probability that he will be between the ages of 45 to 54?
6.0%
13.6%
15.1%
44.6%
The correct Answer is:B
Step by step video & image solution for Each month. The Bureau of Labor Statistics conducts a survey called the Current Population Survey (CPS) to measure unemployement in the United States. Across the country, about 60,000 households are included in the survey sample. These households are grouped by geographic region. A summery of the January 2014 survey results for make responds in one geographica region is shown in the table below. Q. If one unemployed man from this sample is chosen at random for a follow-up survey, what is the probability that he will be between the ages of 45 to 54? by Maths experts to help you in doubts & scoring excellent marks in Class 10 exams.
Updated on:21/07/2023Topper's Solved these Questions
Similar Questions
Each month. The Bureau of Labor Statistics conducts a survey called the Current Population Survey (CPS) to measure unemployement in the United States. Across the country, about 60,000 households are included in the survey sample. These households are grouped by geographic region. A summery of the January 2014 survey results for make responds in one geographica region is shown in the table below.

Q. According to data in the table, for which age group did the smallest percentage of men report that they were unemployed in January 2014?
View SolutionThe species that occur in different geographical regions are called :
View Solution
Knowledge Check
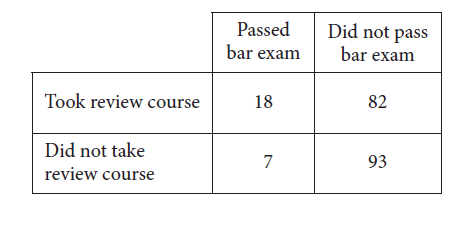
Results on the Bar Exam of Law School Graduates

The table above summarizes the results of 200 law school graduates who took the bar exam. If one of the surveyed graduates who passed the bar exam is chosen at random for an interview, what is the probability that the person chosen did not–––– take the review course?A1825B725C25200D7200
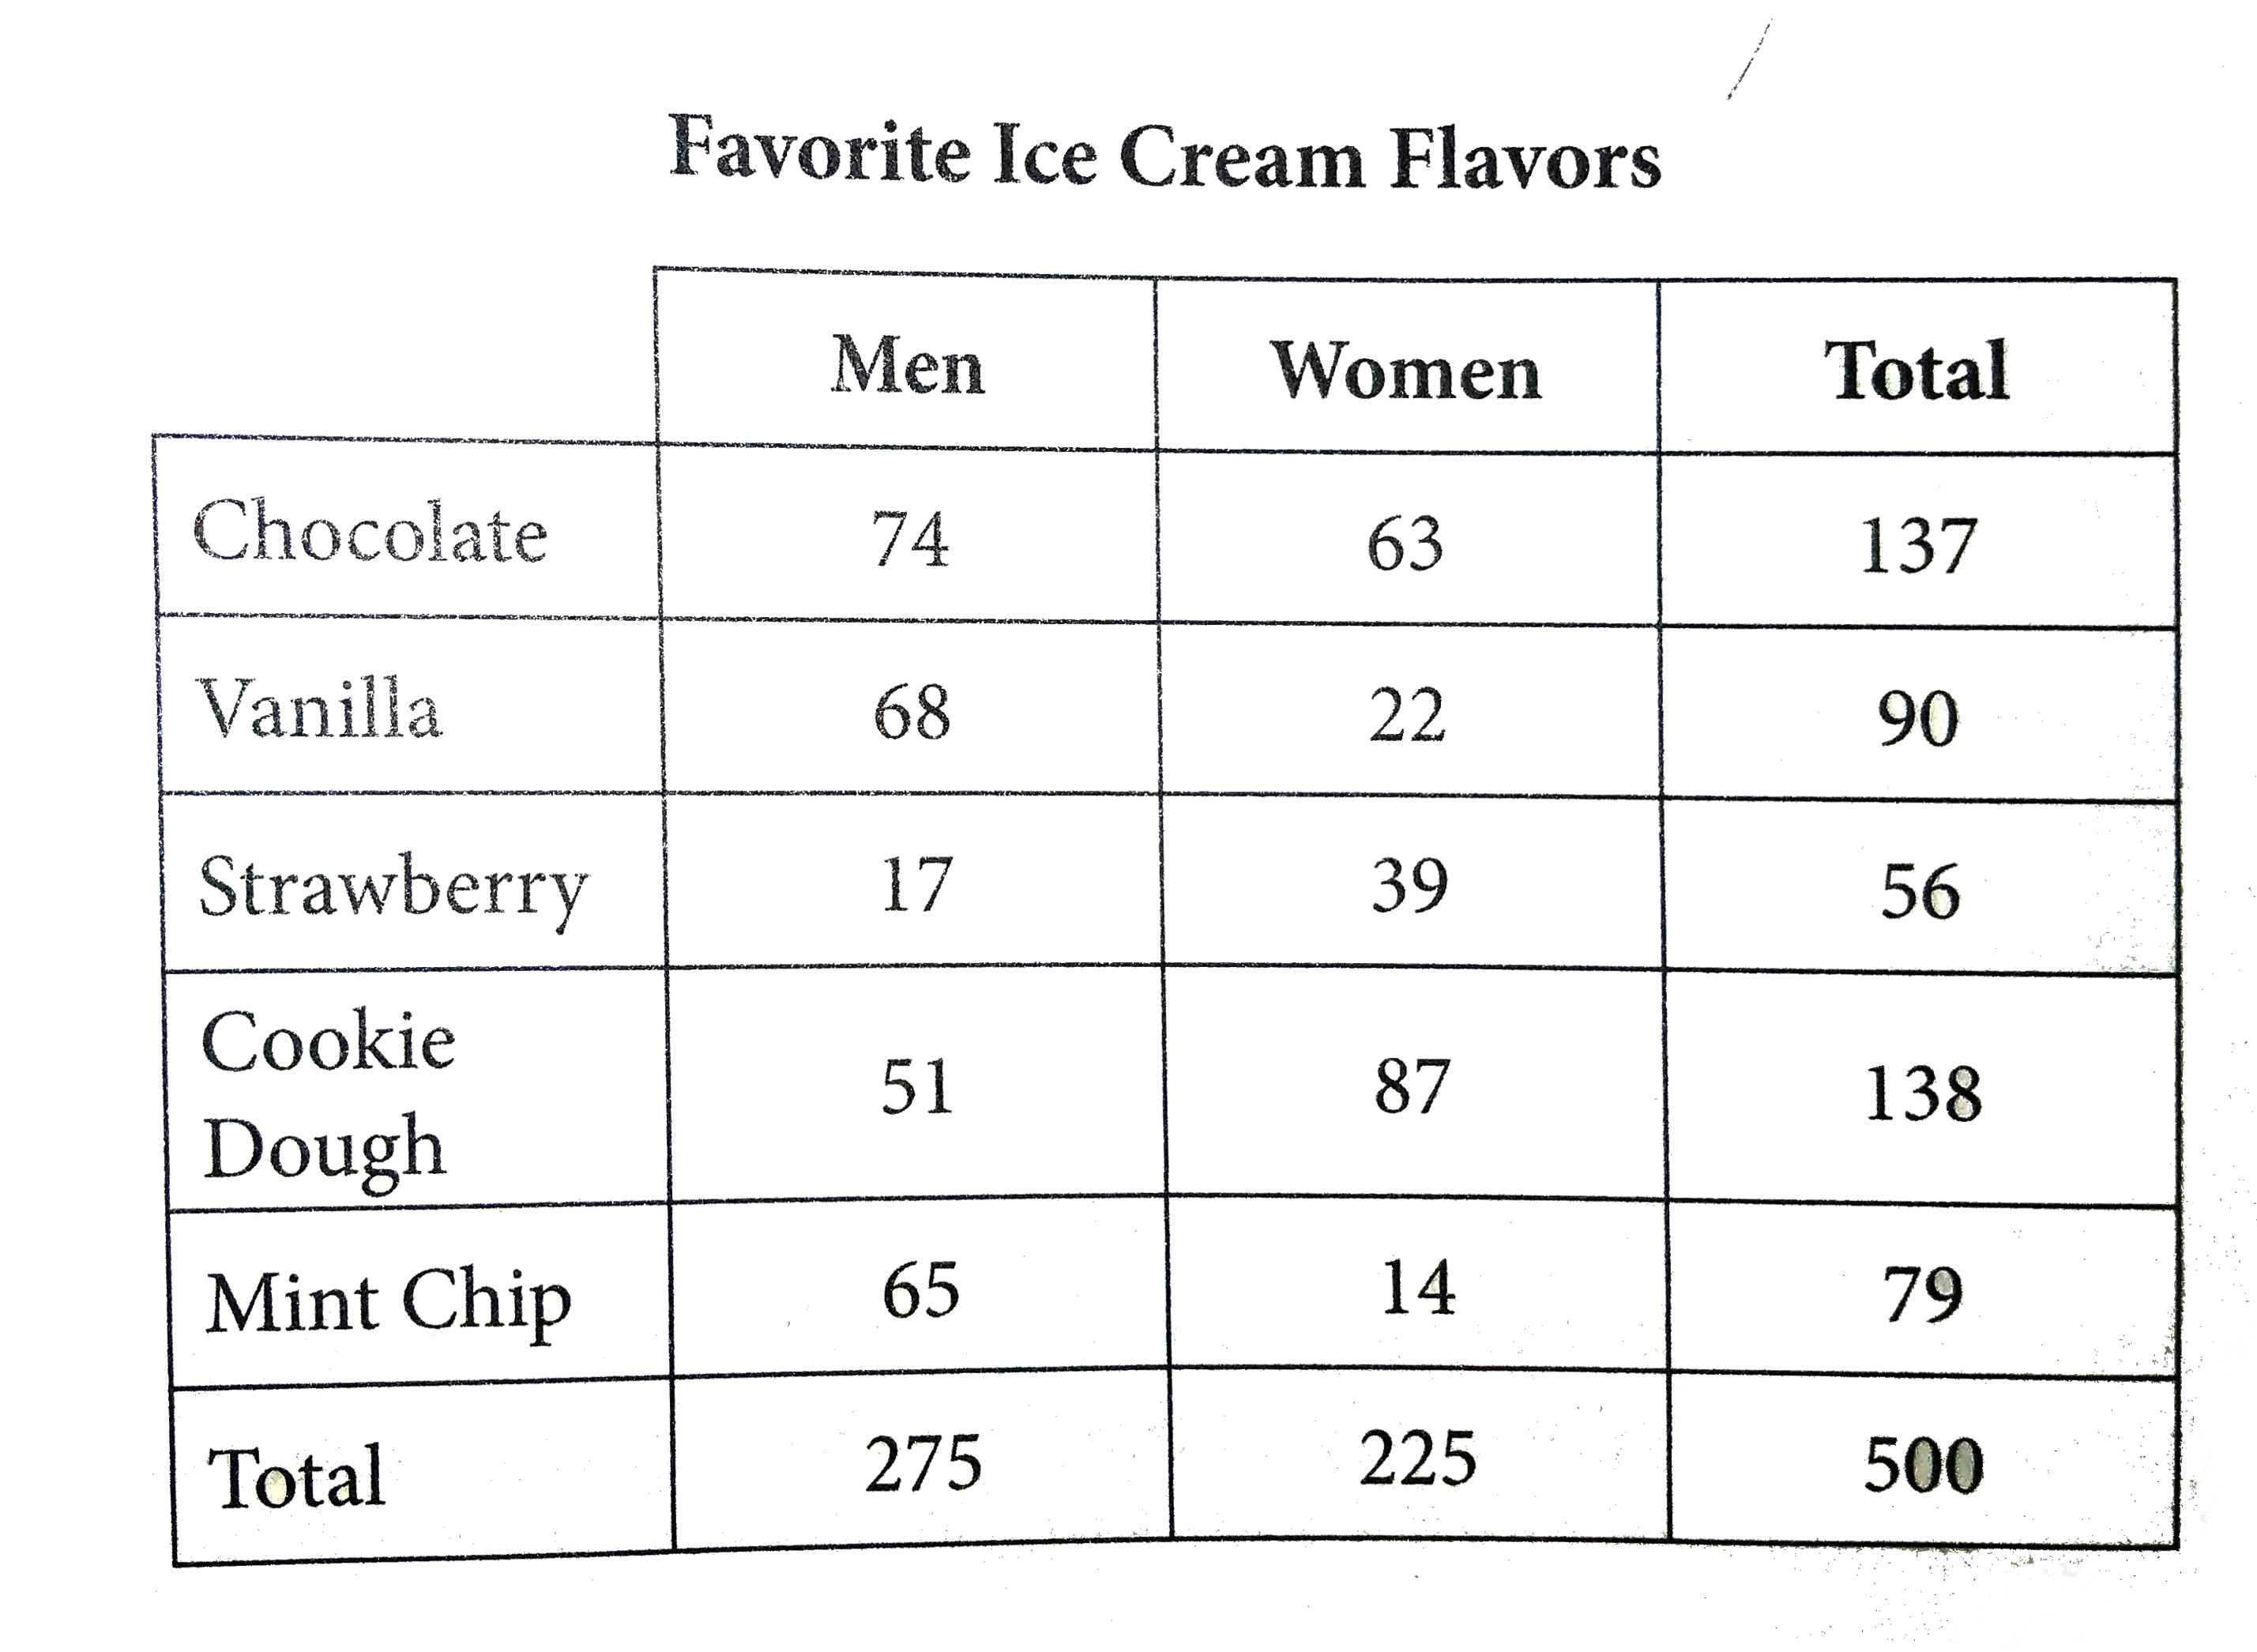
The table above shows the result of a random survey of 500 men and women. Each individual chose a flavor of ice cream that was his or her favorite.
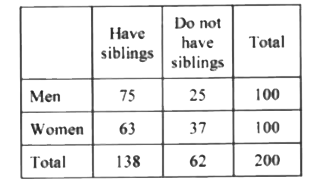
Q. If a woman is chosen at random, what is the probability that her favorite ice cream flavor is strawberry?A0.06B0.09C0.11D0.17A survey was conducted among a randomly chosen sample of 100 males and 100 females to gather data on family size. The data are shown in the table below.

Which of the following is closest to the perecent of those surveyed who have siblings?A31B63C69D75
A survey of 650 men showed that only 52 of them know English. Out of these men, if one is selected at random, what is the probability that the selected man knows English.
View SolutionName the following:
The statistical study of the human population of a region.
View SolutionA recent survey found that the edges ages of workers in a factory as follow.

If a person is selected at random, find the probability that the person is
View Solution
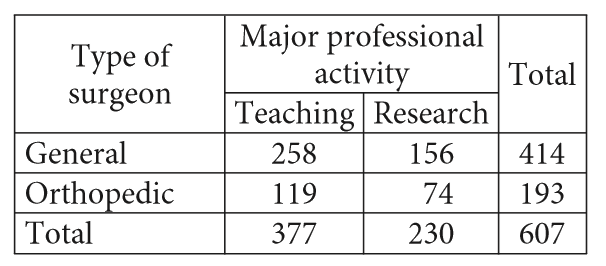
In a survey,607 general surgeons and orthopedic surgeons indicated their major professional activity. The results are summarized in the table above.If one of the surgeons is selected at random,which of the following is closest to the probability that the selected surgeon is a northopedic surgeon whose indicated professional activity is research?
View SolutionA recent survey reported that 60 percent of the students at a high school are girls and 65 percent of girls at this school play a sport. If a student at this high school were selected at random, what is the probability that the student is a girl who plays a sport?
View Solution
