Ekta is asked to collect data for size of shoes of students in her class 6th. Her finding are recorded in the manner shown below:

Arrange the data in a tabular form using tally marks.Solution in Punjabi
Step by step video & image solution for Ekta is asked to collect data for size of shoes of students in her class 6th. Her finding are recorded in the manner shown below: Arrange the data in a tabular form using tally marks. by Maths experts to help you in doubts & scoring excellent marks in Class 6 exams.
Updated on:21/07/2023Topper's Solved these Questions
- DATA HANDLING BOOK - SWAN PUBLICATIONCHAPTER - DATA HANDLING EXERCISE - EXERCISE 14.2
15 Videos
- DATA HANDLING BOOK - SWAN PUBLICATIONCHAPTER - DATA HANDLING EXERCISE - EXERCISE 14.3
5 Videos
- BASIC GEOMETRICAL CONCEPTSBOOK - SWAN PUBLICATIONCHAPTER - BASIC GEOMETRICAL CONCEPTSEXERCISE - MULTIPLE CHOICE QUESTIONS
12 Videos
- DECIMALSBOOK - SWAN PUBLICATIONCHAPTER - DECIMALSEXERCISE - MULTIPLE CHOICE QUESTIONS
20 Videos
Similar Questions
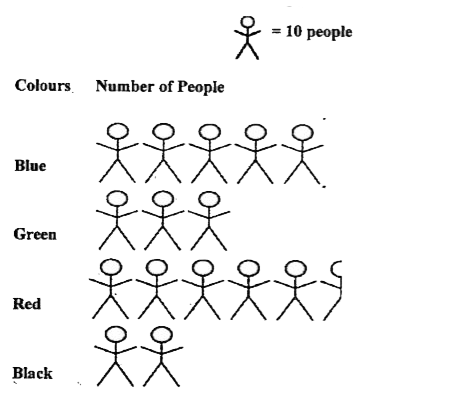
The colour of refrigerators preferred by number of people living in a locality are shown by the following pictograph :

(i) Find the number of people preferring blue colour ?
(ii) How many people liked red colour ?
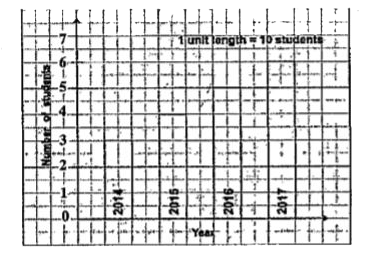
View SolutionRead the adjoining bar graph showing the number of students in a particular class of a school:

Answer tbe following questions :
(i) What is the scale of.this graph ?
(ii) How many students are there in 2016 ?
(iii) Is the number of students in the year 2017 twice the year 2014 ?
View SolutionHow many lines can pass through a point ?
View Solution3+210=.............
View SolutionEkta is asked to collect data for size of shoes of students in her Class VI. Her finding are recorded in the manner shown below

View SolutionDetermine the point of symmetry of a regular hexagon.
View SolutionMatch the following Column A to Column B

View SolutionMatch the following Column A to Column B

View SolutionMatch the following Column A to Column B

View SolutionFind the area of figure given below.

View SolutionFind the perimeter of the figure given below.

View SolutionFind the area of the figure given below.

View SolutionThe inequation represented by the graph given below is :
View SolutionThe inequation that best describes the graph given below is _________
View SolutionThe inequation that best describes the following graph is _________
View SolutionThe equation of straight line shown in figure is :
ltimg src="https://d10lpgp6xz60nq.cloudfront.net/physics_images/ALN_PHY_R04_E01_020_Q01.png" width="80%"gt
View Solution
