Find the mean marks of students from the following cumulative frequency
distribution:
marks No. of Students Marks No. of Students
0 and above
10 and above
20 and above
30 and above
40 and above
50 and above 80
77
72
65
55
43 60 and above
70 and above
80 and above
90 and above
100 and above 28
16
10
8
0
To find the mean marks of students from the given cumulative frequency distribution, we will follow these steps:
Step 1: Create a frequency distribution table
We will first convert the cumulative frequency distribution into a frequency distribution. The cumulative frequencies provided are:
- 0 and above: 80
- 10 and above: 77
- 20 and above: 72
- 30 and above: 65
- 40 and above: 55
- 50 and above: 43
- 60 and above: 28
- 70 and above: 16
- 80 and above: 10
- 90 and above: 8
- 100 and above: 0
Now, we will calculate the frequency for each class interval by subtracting the cumulative frequencies:
| Marks Interval | Cumulative Frequency | Frequency (f) |
|----------------|----------------------|----------------|
| 0 - 10 | 80 | 80 - 77 = 3 |
| 10 - 20 | 77 | 77 - 72 = 5 |
| 20 - 30 | 72 | 72 - 65 = 7 |
| 30 - 40 | 65 | 65 - 55 = 10 |
| 40 - 50 | 55 | 55 - 43 = 12 |
| 50 - 60 | 43 | 43 - 28 = 15 |
| 60 - 70 | 28 | 28 - 16 = 12 |
| 70 - 80 | 16 | 16 - 10 = 6 |
| 80 - 90 | 10 | 10 - 8 = 2 |
| 90 - 100 | 8 | 8 - 0 = 8 |
| 100 - 110 | 0 | 0 |
Step 2: Calculate the class marks (x_i)
The class mark for each interval is calculated as the average of the upper and lower limits of each class.
| Marks Interval | Class Mark (x_i) |
|----------------|------------------|
| 0 - 10 | (0 + 10)/2 = 5 |
| 10 - 20 | (10 + 20)/2 = 15 |
| 20 - 30 | (20 + 30)/2 = 25 |
| 30 - 40 | (30 + 40)/2 = 35 |
| 40 - 50 | (40 + 50)/2 = 45 |
| 50 - 60 | (50 + 60)/2 = 55 |
| 60 - 70 | (60 + 70)/2 = 65 |
| 70 - 80 | (70 + 80)/2 = 75 |
| 80 - 90 | (80 + 90)/2 = 85 |
| 90 - 100 | (90 + 100)/2 = 95 |
| 100 - 110 | (100 + 110)/2 = 105 |
Step 3: Calculate f_i * x_i
Now, we will multiply the frequency (f) by the class mark (x_i) for each class.
| Marks Interval | Frequency (f) | Class Mark (x_i) | f_i * x_i |
|----------------|----------------|------------------|-----------|
| 0 - 10 | 3 | 5 | 15 |
| 10 - 20 | 5 | 15 | 75 |
| 20 - 30 | 7 | 25 | 175 |
| 30 - 40 | 10 | 35 | 350 |
| 40 - 50 | 12 | 45 | 540 |
| 50 - 60 | 15 | 55 | 825 |
| 60 - 70 | 12 | 65 | 780 |
| 70 - 80 | 6 | 75 | 450 |
| 80 - 90 | 2 | 85 | 170 |
| 90 - 100 | 8 | 95 | 760 |
| 100 - 110 | 0 | 105 | 0 |
Step 4: Calculate the total of f_i and f_i * x_i
Now, we will sum up the frequency and the f_i * x_i values.
- Total frequency (Σf_i) = 3 + 5 + 7 + 10 + 12 + 15 + 12 + 6 + 2 + 8 + 0 = 80
- Total f_i * x_i (Σf_i * x_i) = 15 + 75 + 175 + 350 + 540 + 825 + 780 + 450 + 170 + 760 + 0 = 4140
Step 5: Calculate the mean
Finally, we can calculate the mean using the formula:
Mean(¯x)=ΣfixiΣfi=414080=51.75
Thus, the mean marks of the students is 51.75.
---
We will first convert the cumulative frequency distribution into a frequency distribution. The cumulative frequencies provided are:
- 10 and above: 77
- 20 and above: 72
- 30 and above: 65
- 40 and above: 55
- 50 and above: 43
- 60 and above: 28
- 70 and above: 16
- 80 and above: 10
- 90 and above: 8
- 100 and above: 0
|----------------|----------------------|----------------|
| 0 - 10 | 80 | 80 - 77 = 3 |
| 10 - 20 | 77 | 77 - 72 = 5 |
| 20 - 30 | 72 | 72 - 65 = 7 |
| 30 - 40 | 65 | 65 - 55 = 10 |
| 40 - 50 | 55 | 55 - 43 = 12 |
| 50 - 60 | 43 | 43 - 28 = 15 |
| 60 - 70 | 28 | 28 - 16 = 12 |
| 70 - 80 | 16 | 16 - 10 = 6 |
| 80 - 90 | 10 | 10 - 8 = 2 |
| 90 - 100 | 8 | 8 - 0 = 8 |
| 100 - 110 | 0 | 0 |
The class mark for each interval is calculated as the average of the upper and lower limits of each class.
|----------------|------------------|
| 0 - 10 | (0 + 10)/2 = 5 |
| 10 - 20 | (10 + 20)/2 = 15 |
| 20 - 30 | (20 + 30)/2 = 25 |
| 30 - 40 | (30 + 40)/2 = 35 |
| 40 - 50 | (40 + 50)/2 = 45 |
| 50 - 60 | (50 + 60)/2 = 55 |
| 60 - 70 | (60 + 70)/2 = 65 |
| 70 - 80 | (70 + 80)/2 = 75 |
| 80 - 90 | (80 + 90)/2 = 85 |
| 90 - 100 | (90 + 100)/2 = 95 |
| 100 - 110 | (100 + 110)/2 = 105 |
Now, we will multiply the frequency (f) by the class mark (x_i) for each class.
|----------------|----------------|------------------|-----------|
| 0 - 10 | 3 | 5 | 15 |
| 10 - 20 | 5 | 15 | 75 |
| 20 - 30 | 7 | 25 | 175 |
| 30 - 40 | 10 | 35 | 350 |
| 40 - 50 | 12 | 45 | 540 |
| 50 - 60 | 15 | 55 | 825 |
| 60 - 70 | 12 | 65 | 780 |
| 70 - 80 | 6 | 75 | 450 |
| 80 - 90 | 2 | 85 | 170 |
| 90 - 100 | 8 | 95 | 760 |
| 100 - 110 | 0 | 105 | 0 |
Now, we will sum up the frequency and the f_i * x_i values.
- Total f_i * x_i (Σf_i * x_i) = 15 + 75 + 175 + 350 + 540 + 825 + 780 + 450 + 170 + 760 + 0 = 4140
Finally, we can calculate the mean using the formula:
Topper's Solved these Questions
Similar Questions
Knowledge Check
- Question 1 - Select One
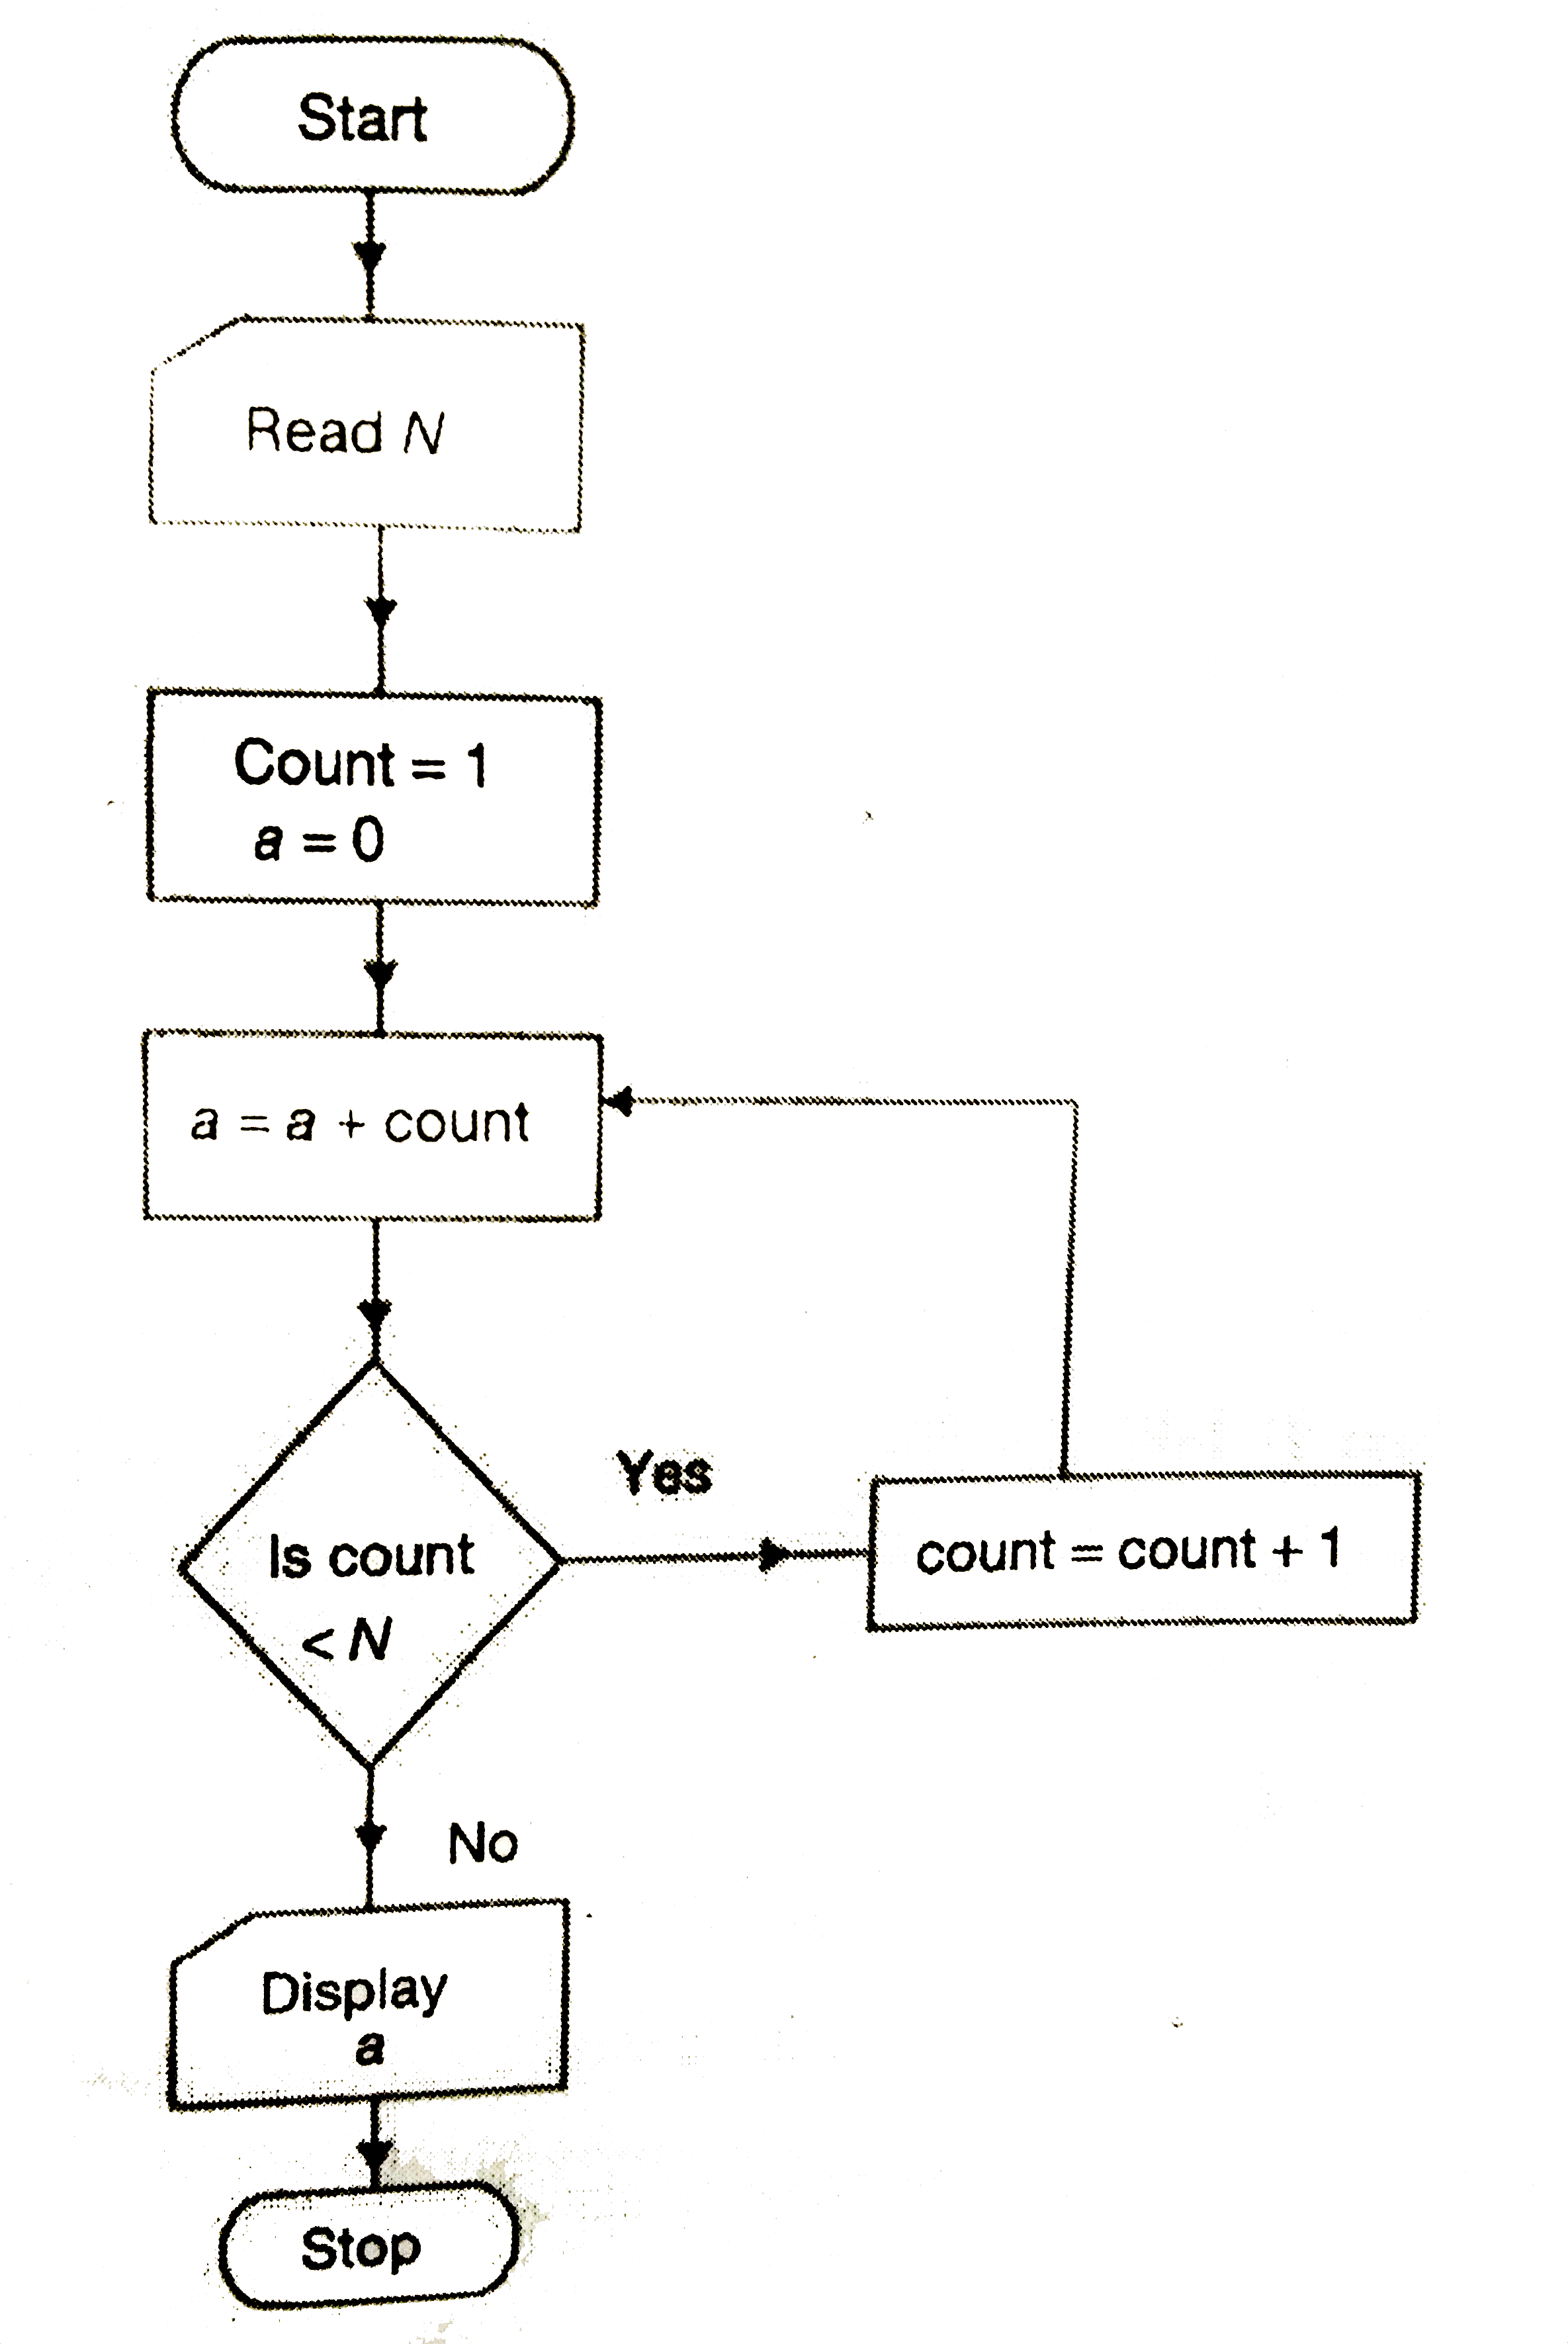
In the above flowchart if N= 10 then what is the output?A55B50C60Dnone of these
Find the mean deviation about arithmetic mean of the following frequency distribution.Marks 0−10,10−20,20−30,30−40,40−50 No. of Students 5,8,15,16,6
View SolutionFind the probability that a student obtained marks 60 or above.
View SolutionWrite the opposite of each of the following:
10 m above the danger mark of river GangaView SolutionThe following table show tha cumulative frequency distribution of marks of 800 students in an examination.
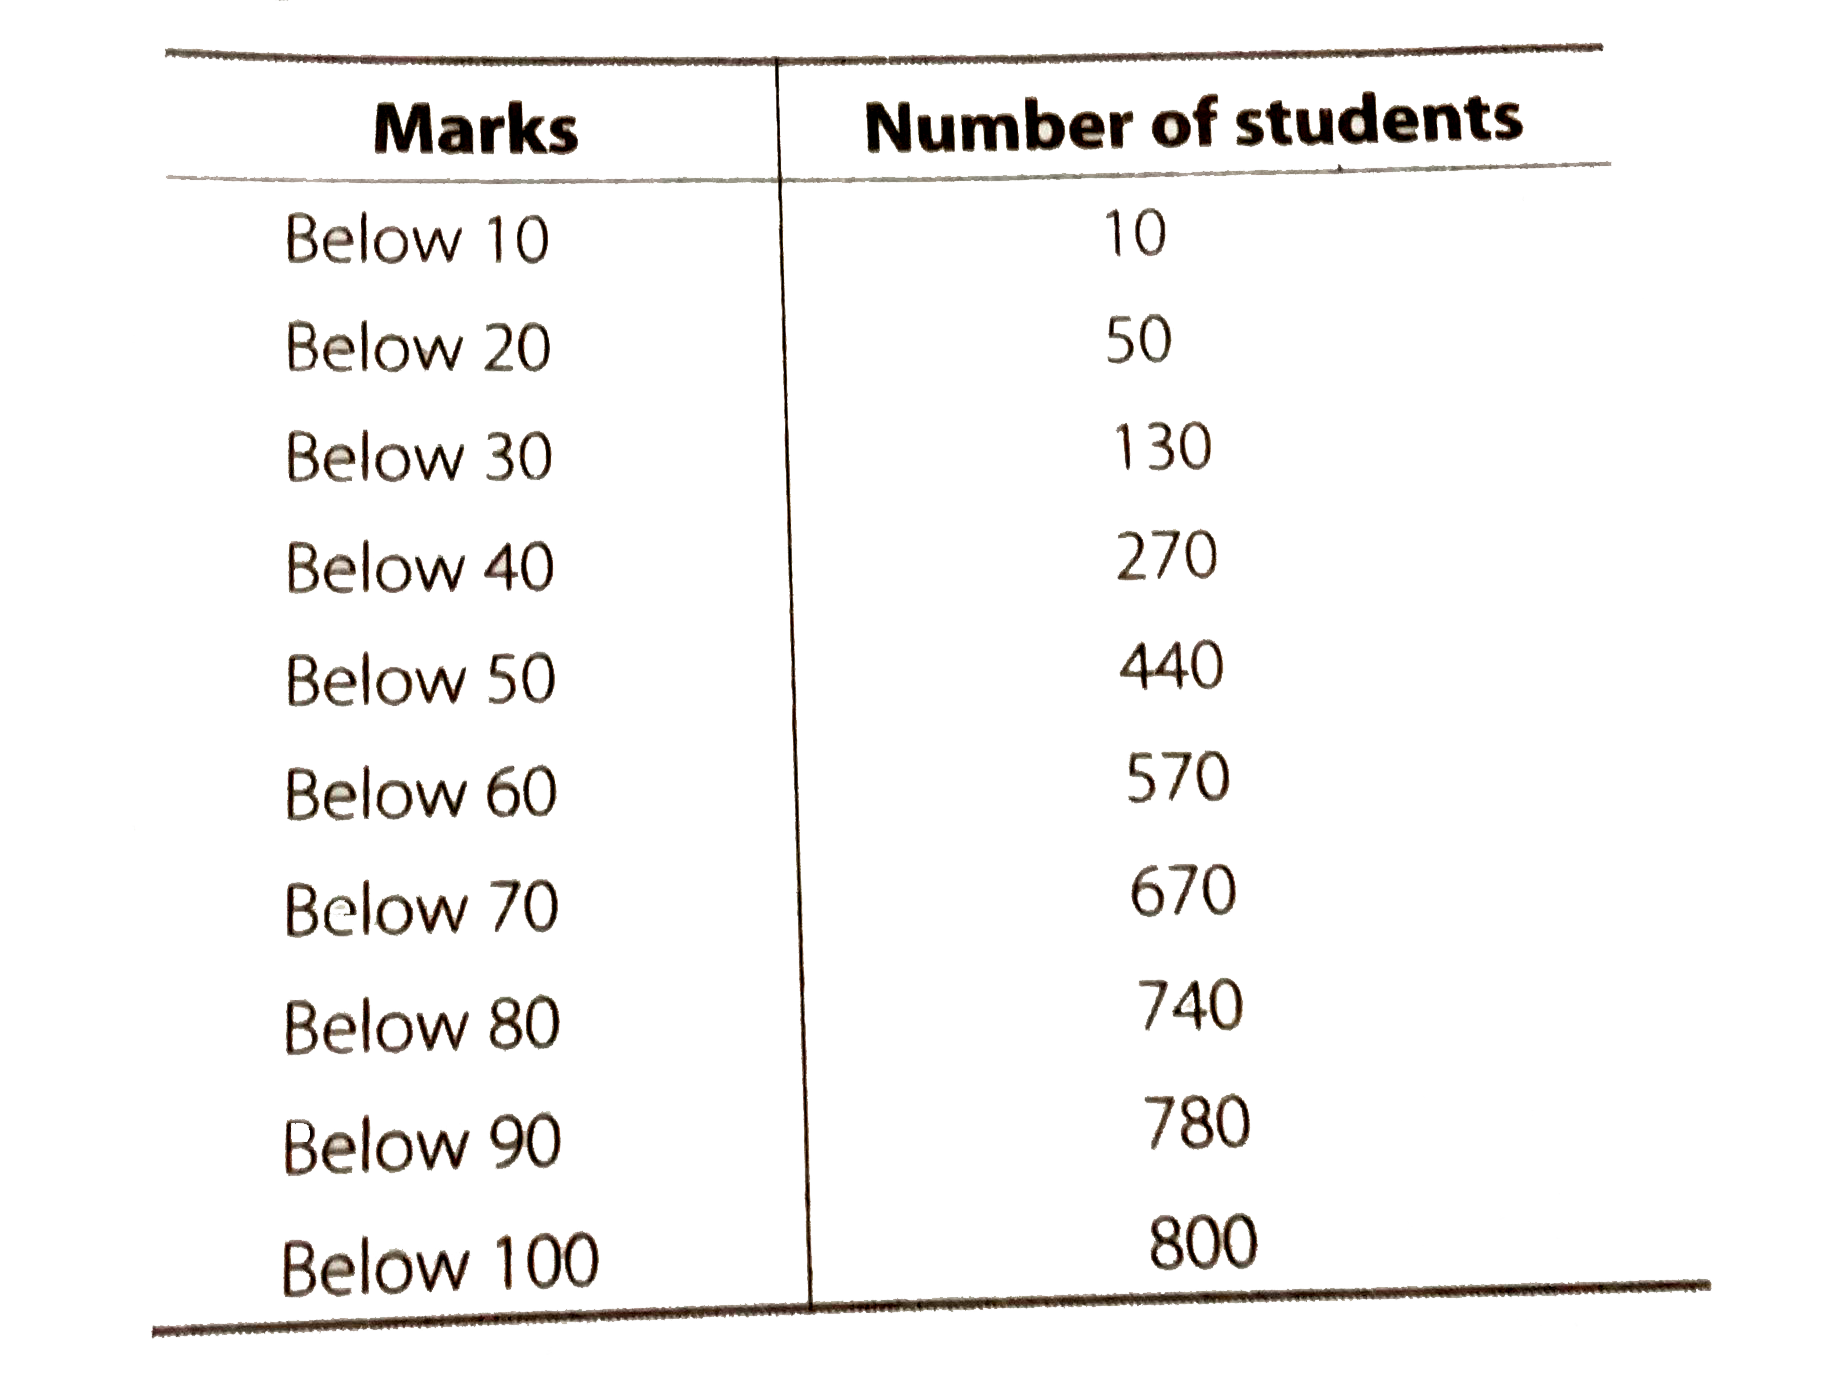
Construct a frequency distribution table for the data above.View SolutionIn question 2 above, the number of students who scored marks less than 4 is
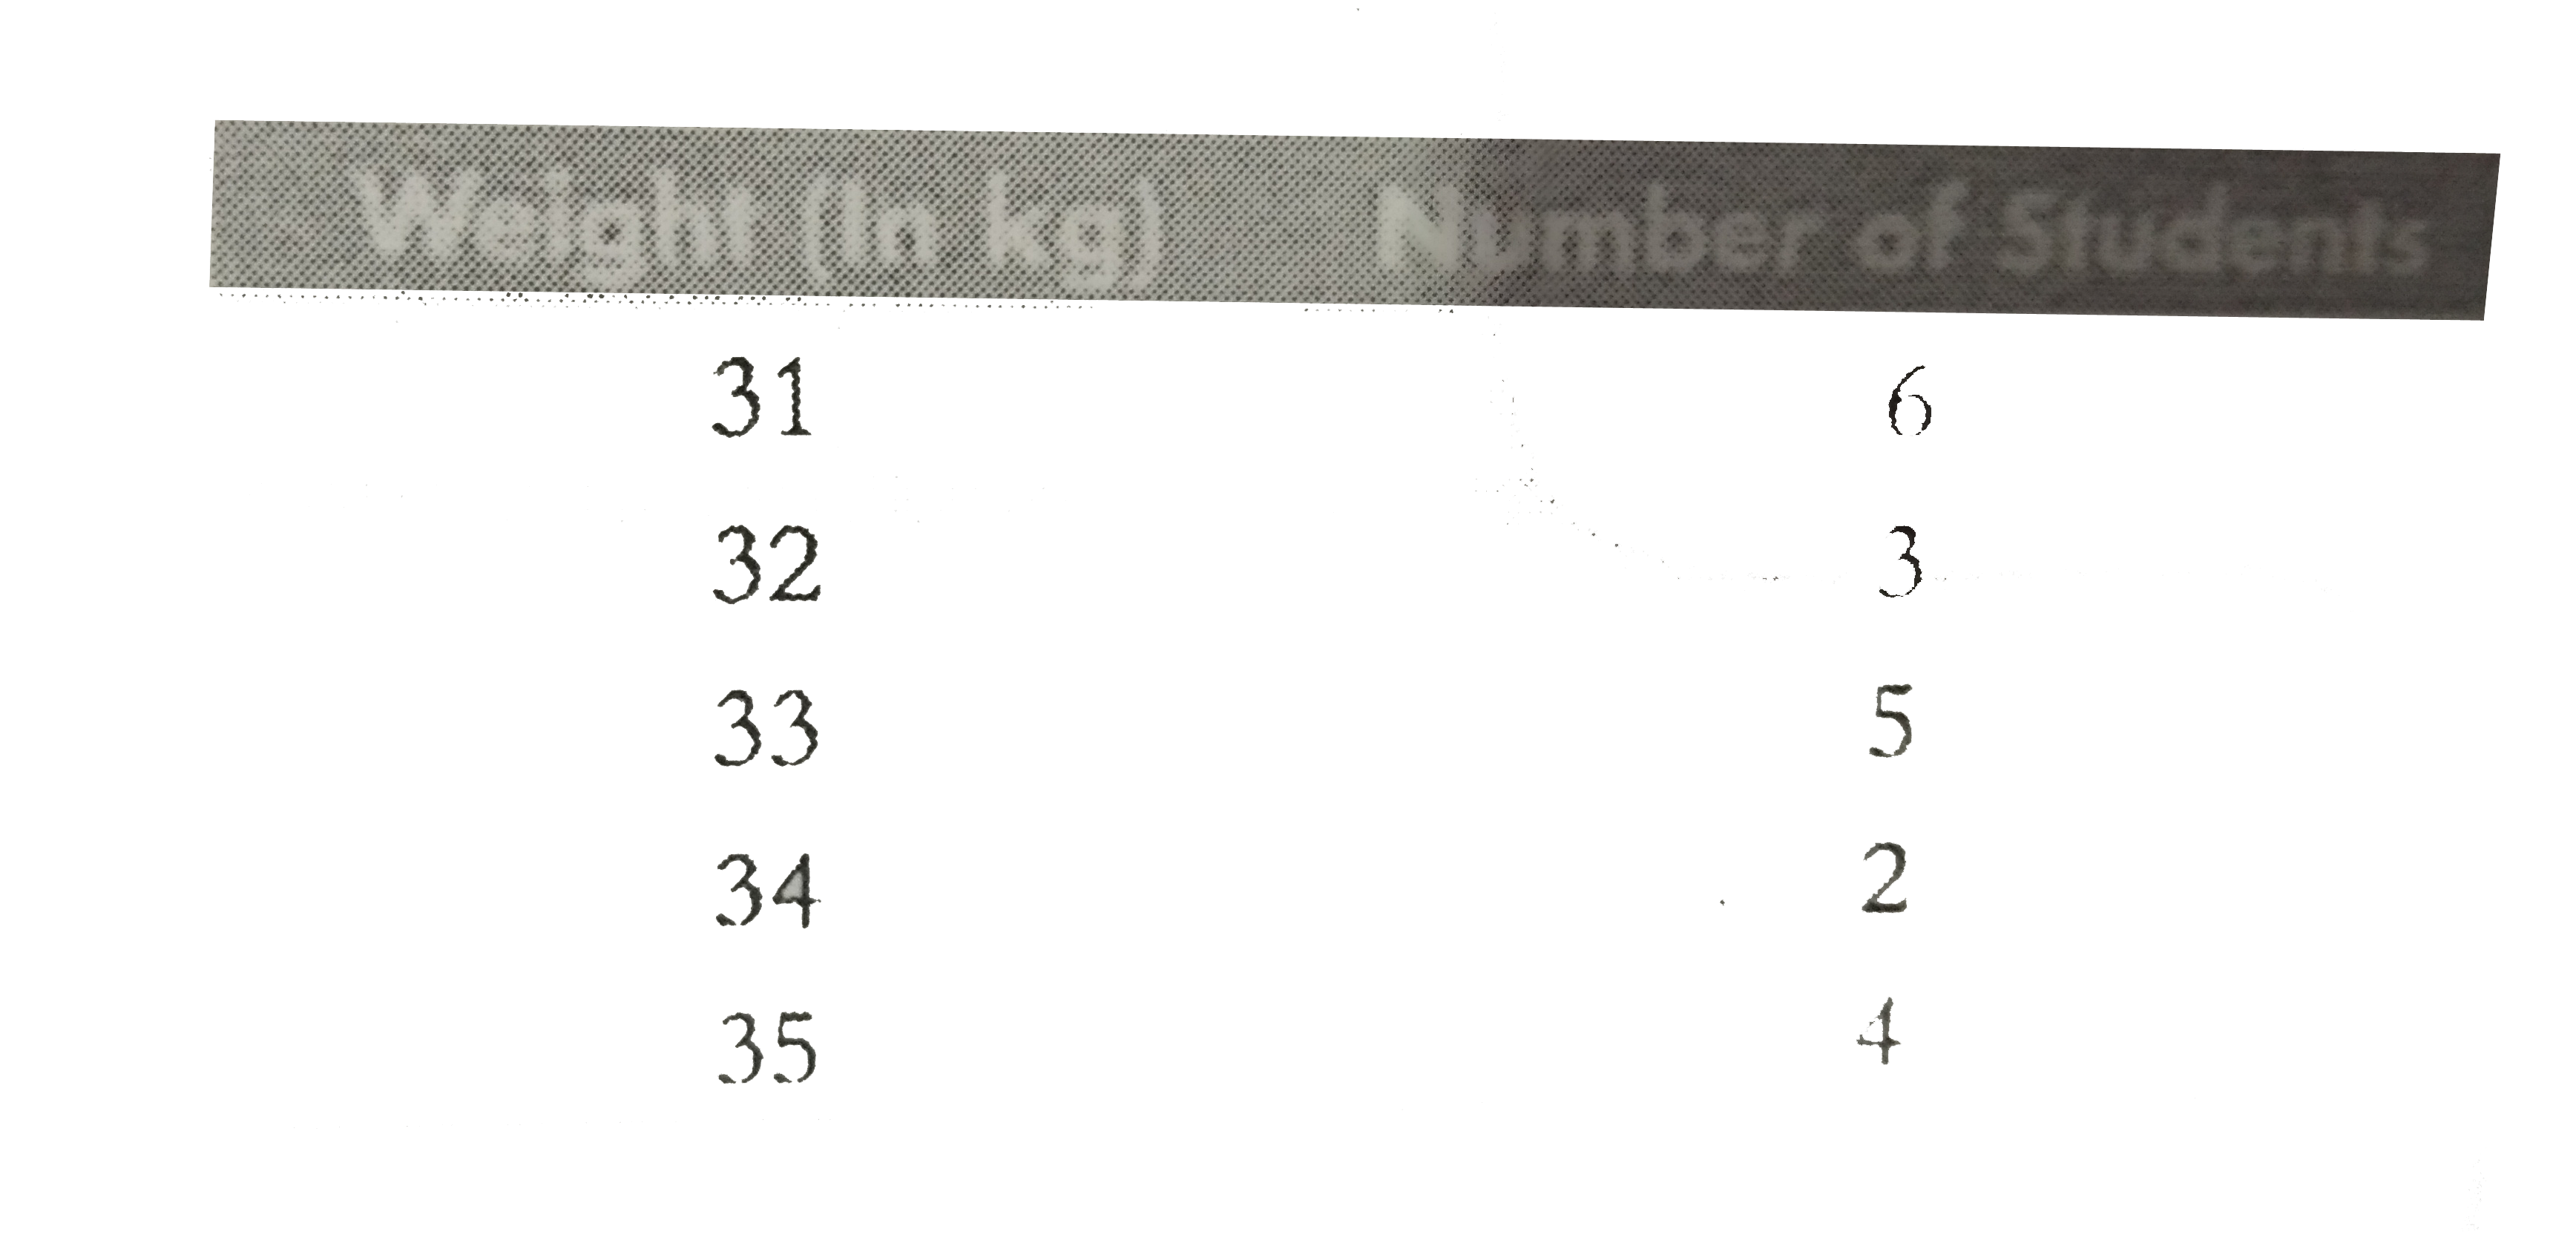
View SolutionThe weights of 20 students in a class are given below.
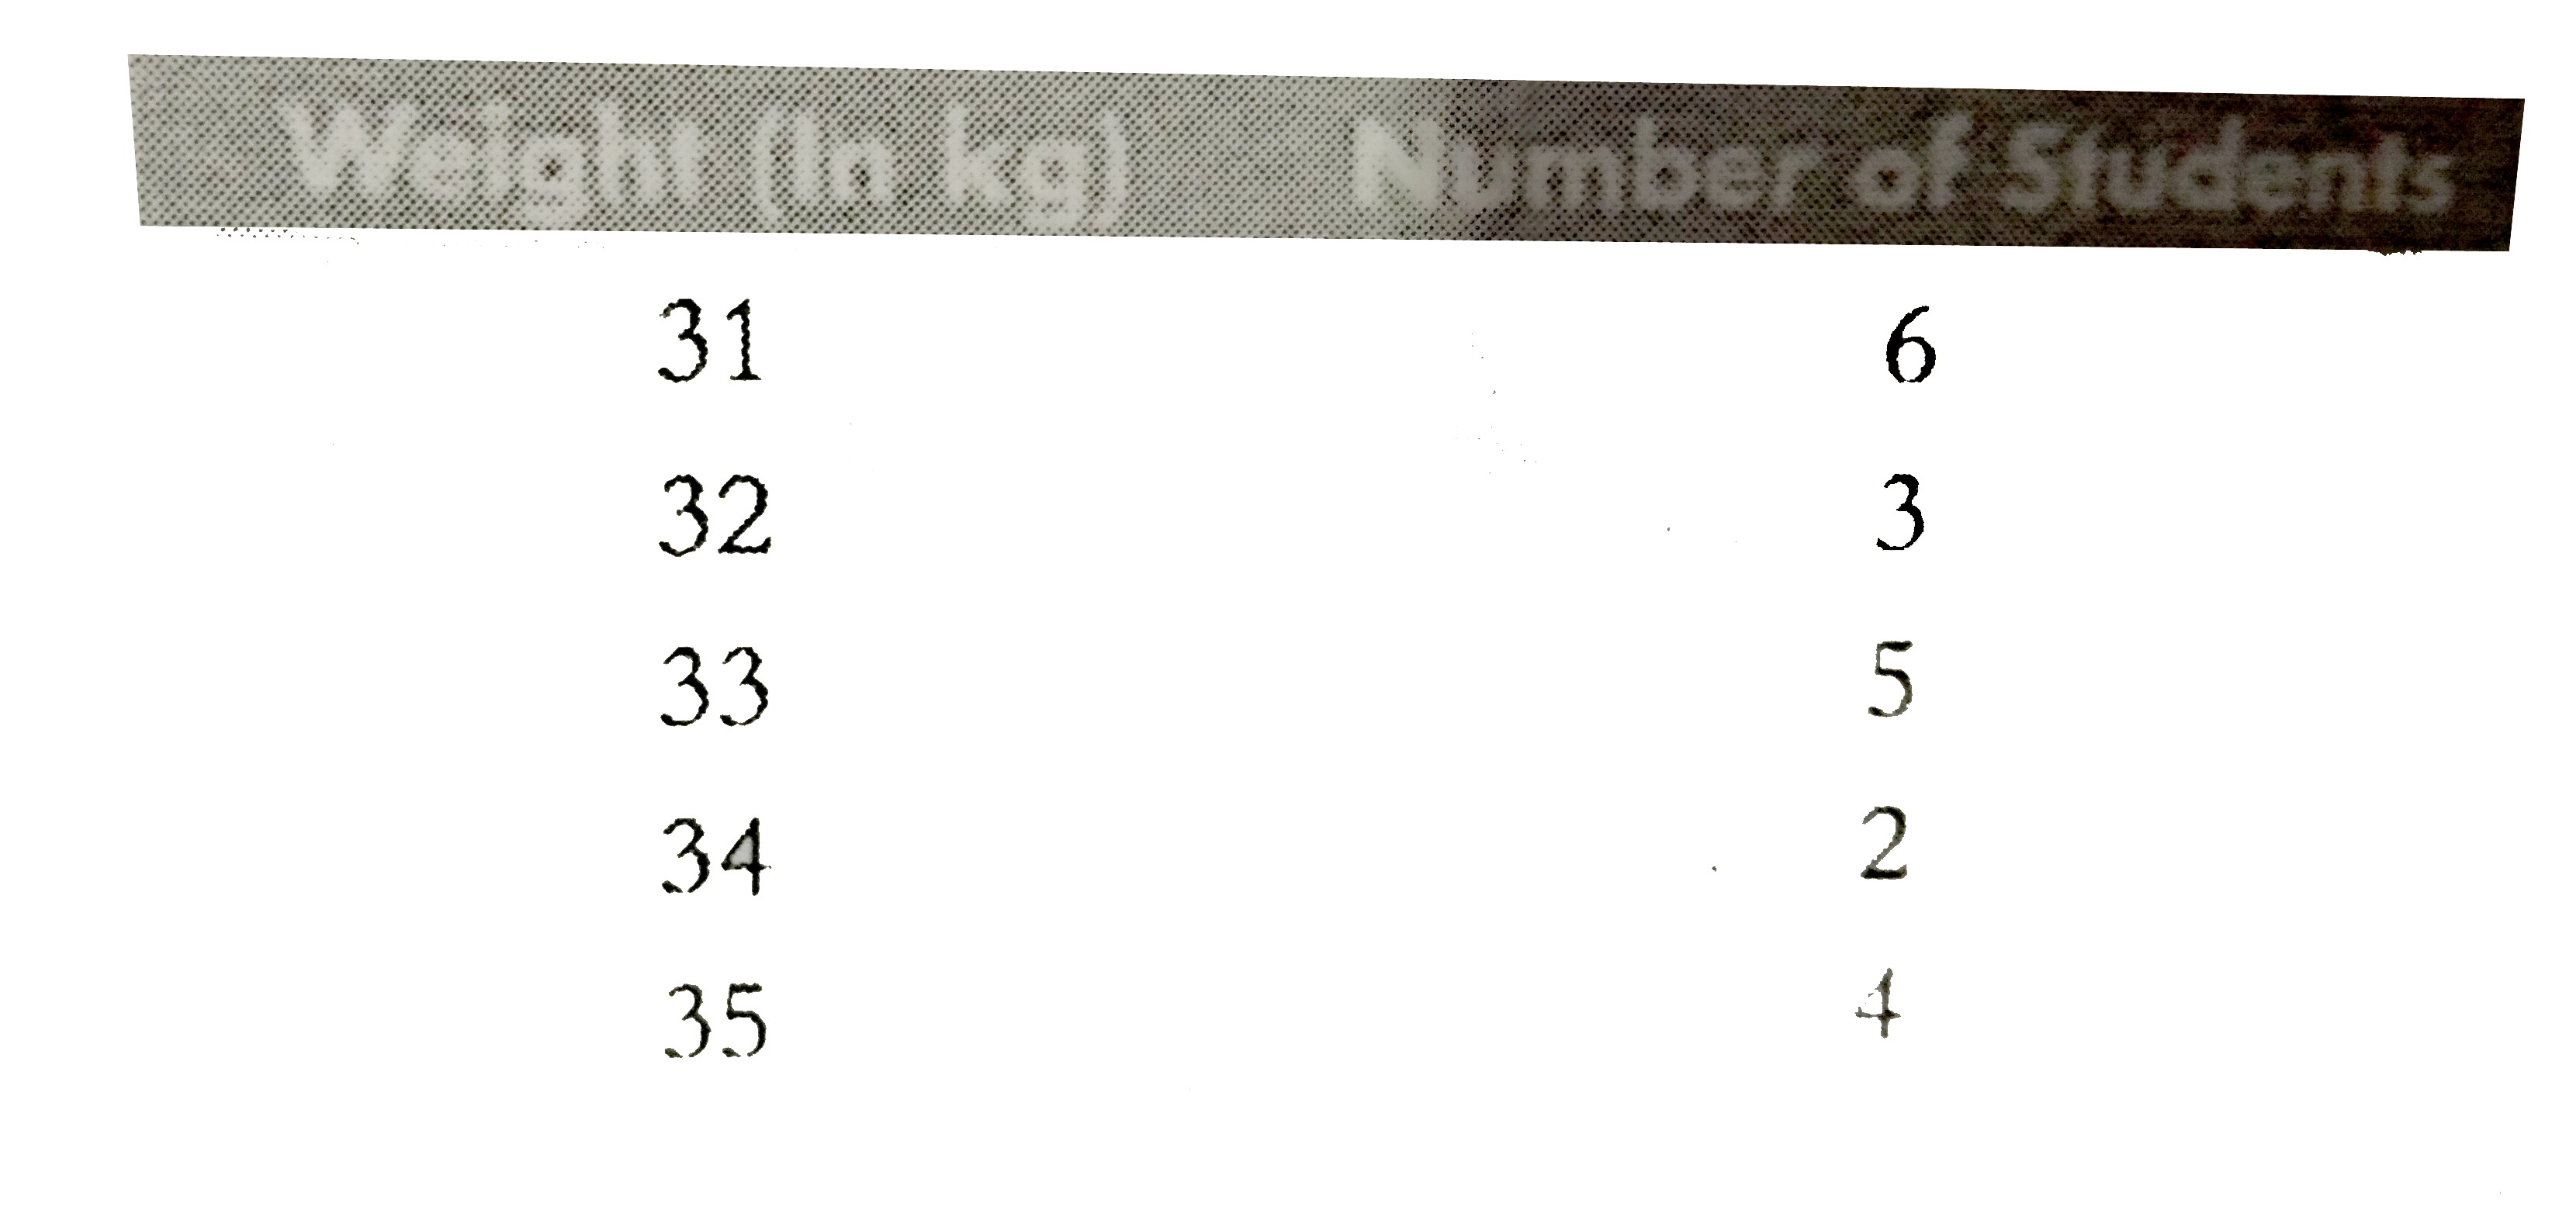
The interquartile range of the above frequency distribution is ______.View SolutionConsider the following distribution :
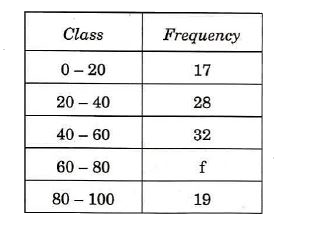
If the mean of the above distribution is 50, what is the value of f?View Solution


