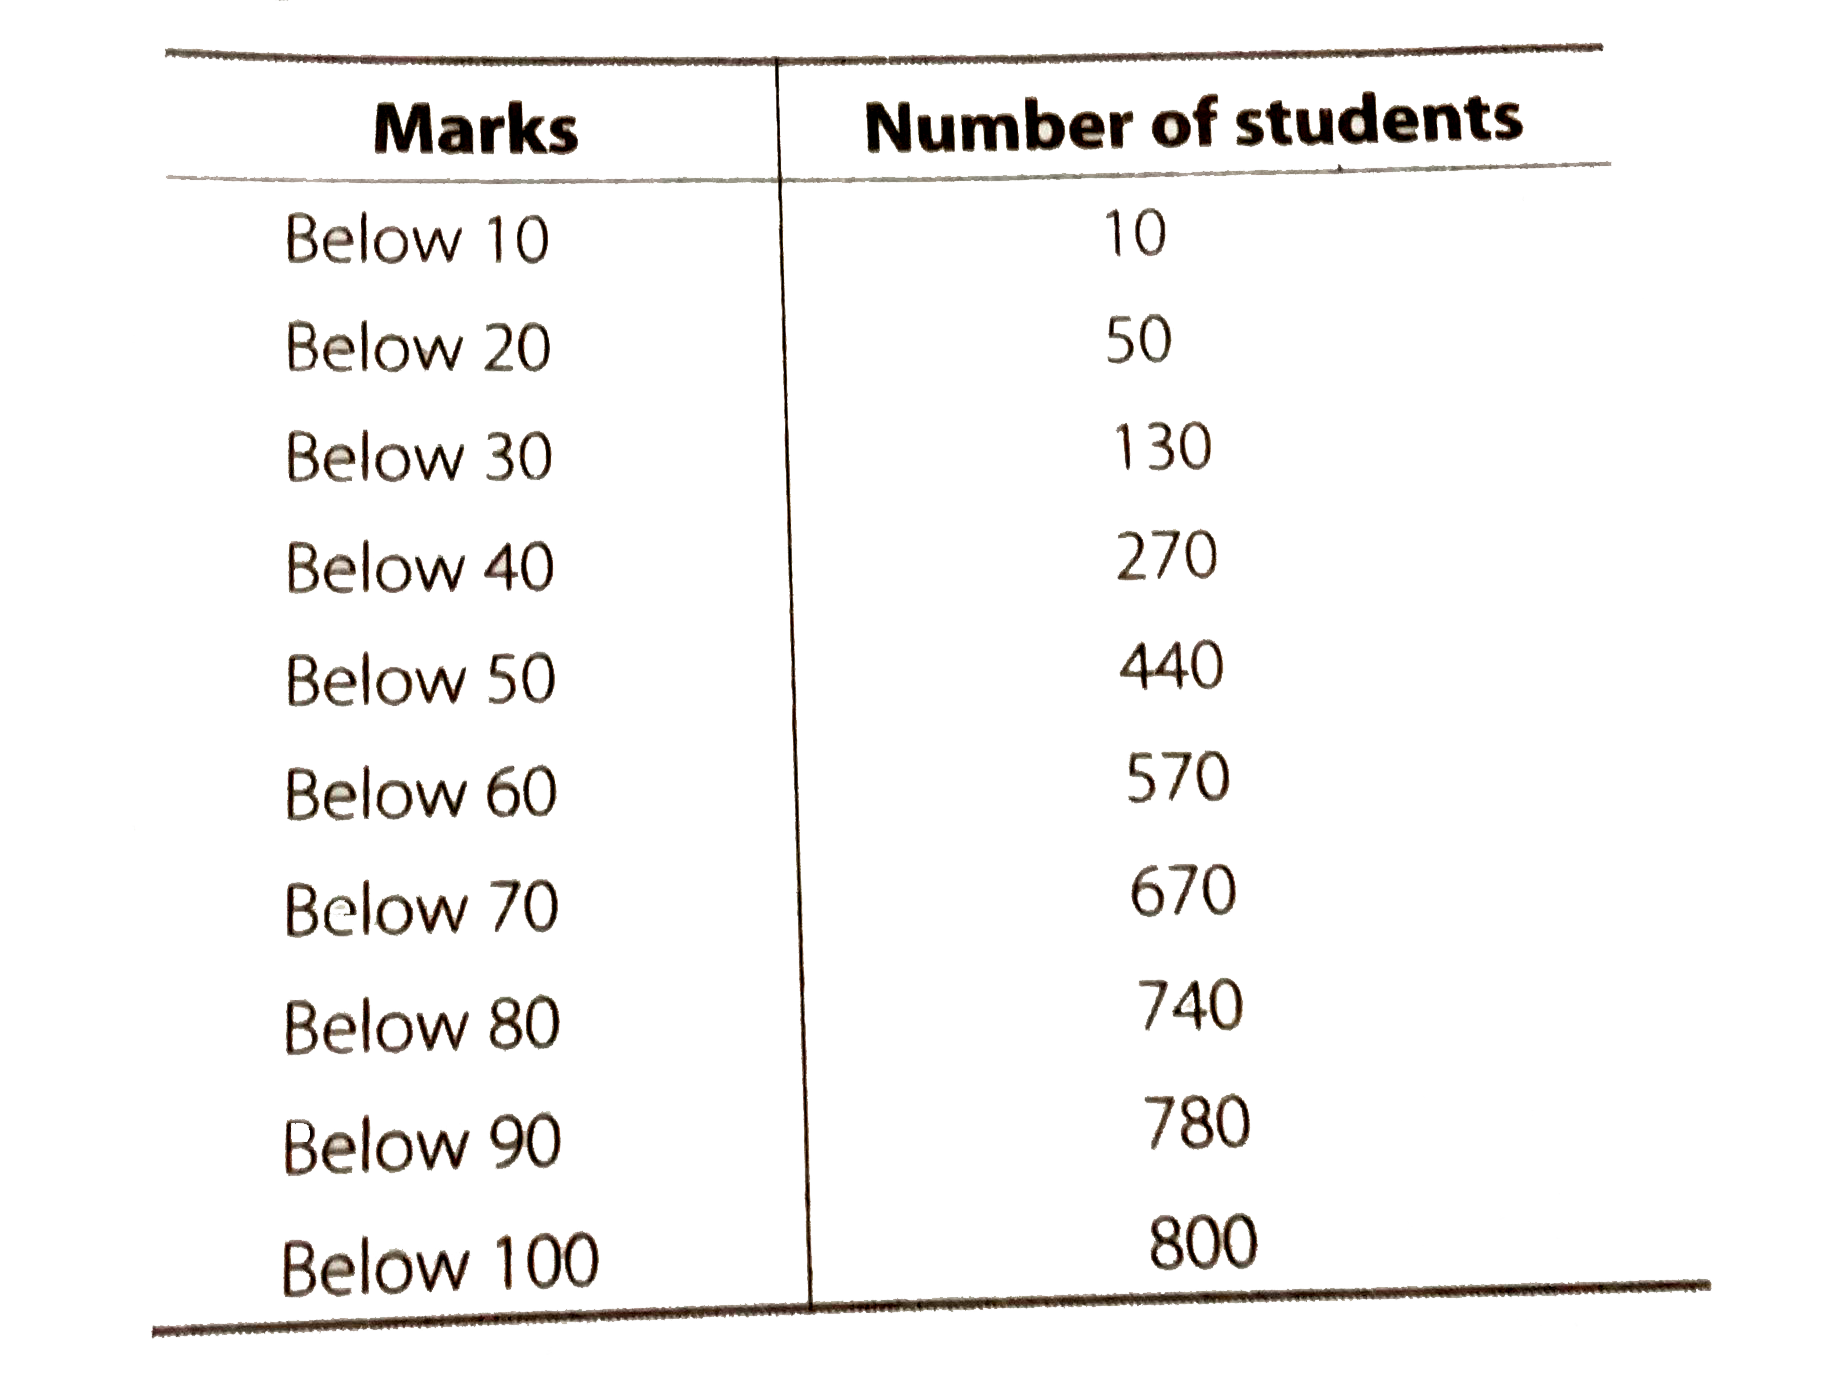
The following table show tha cumulative frequency distribution of marks of 800 students in an examination.

Construct a frequency distribution table for the data above.
Video Solution
Text Solution
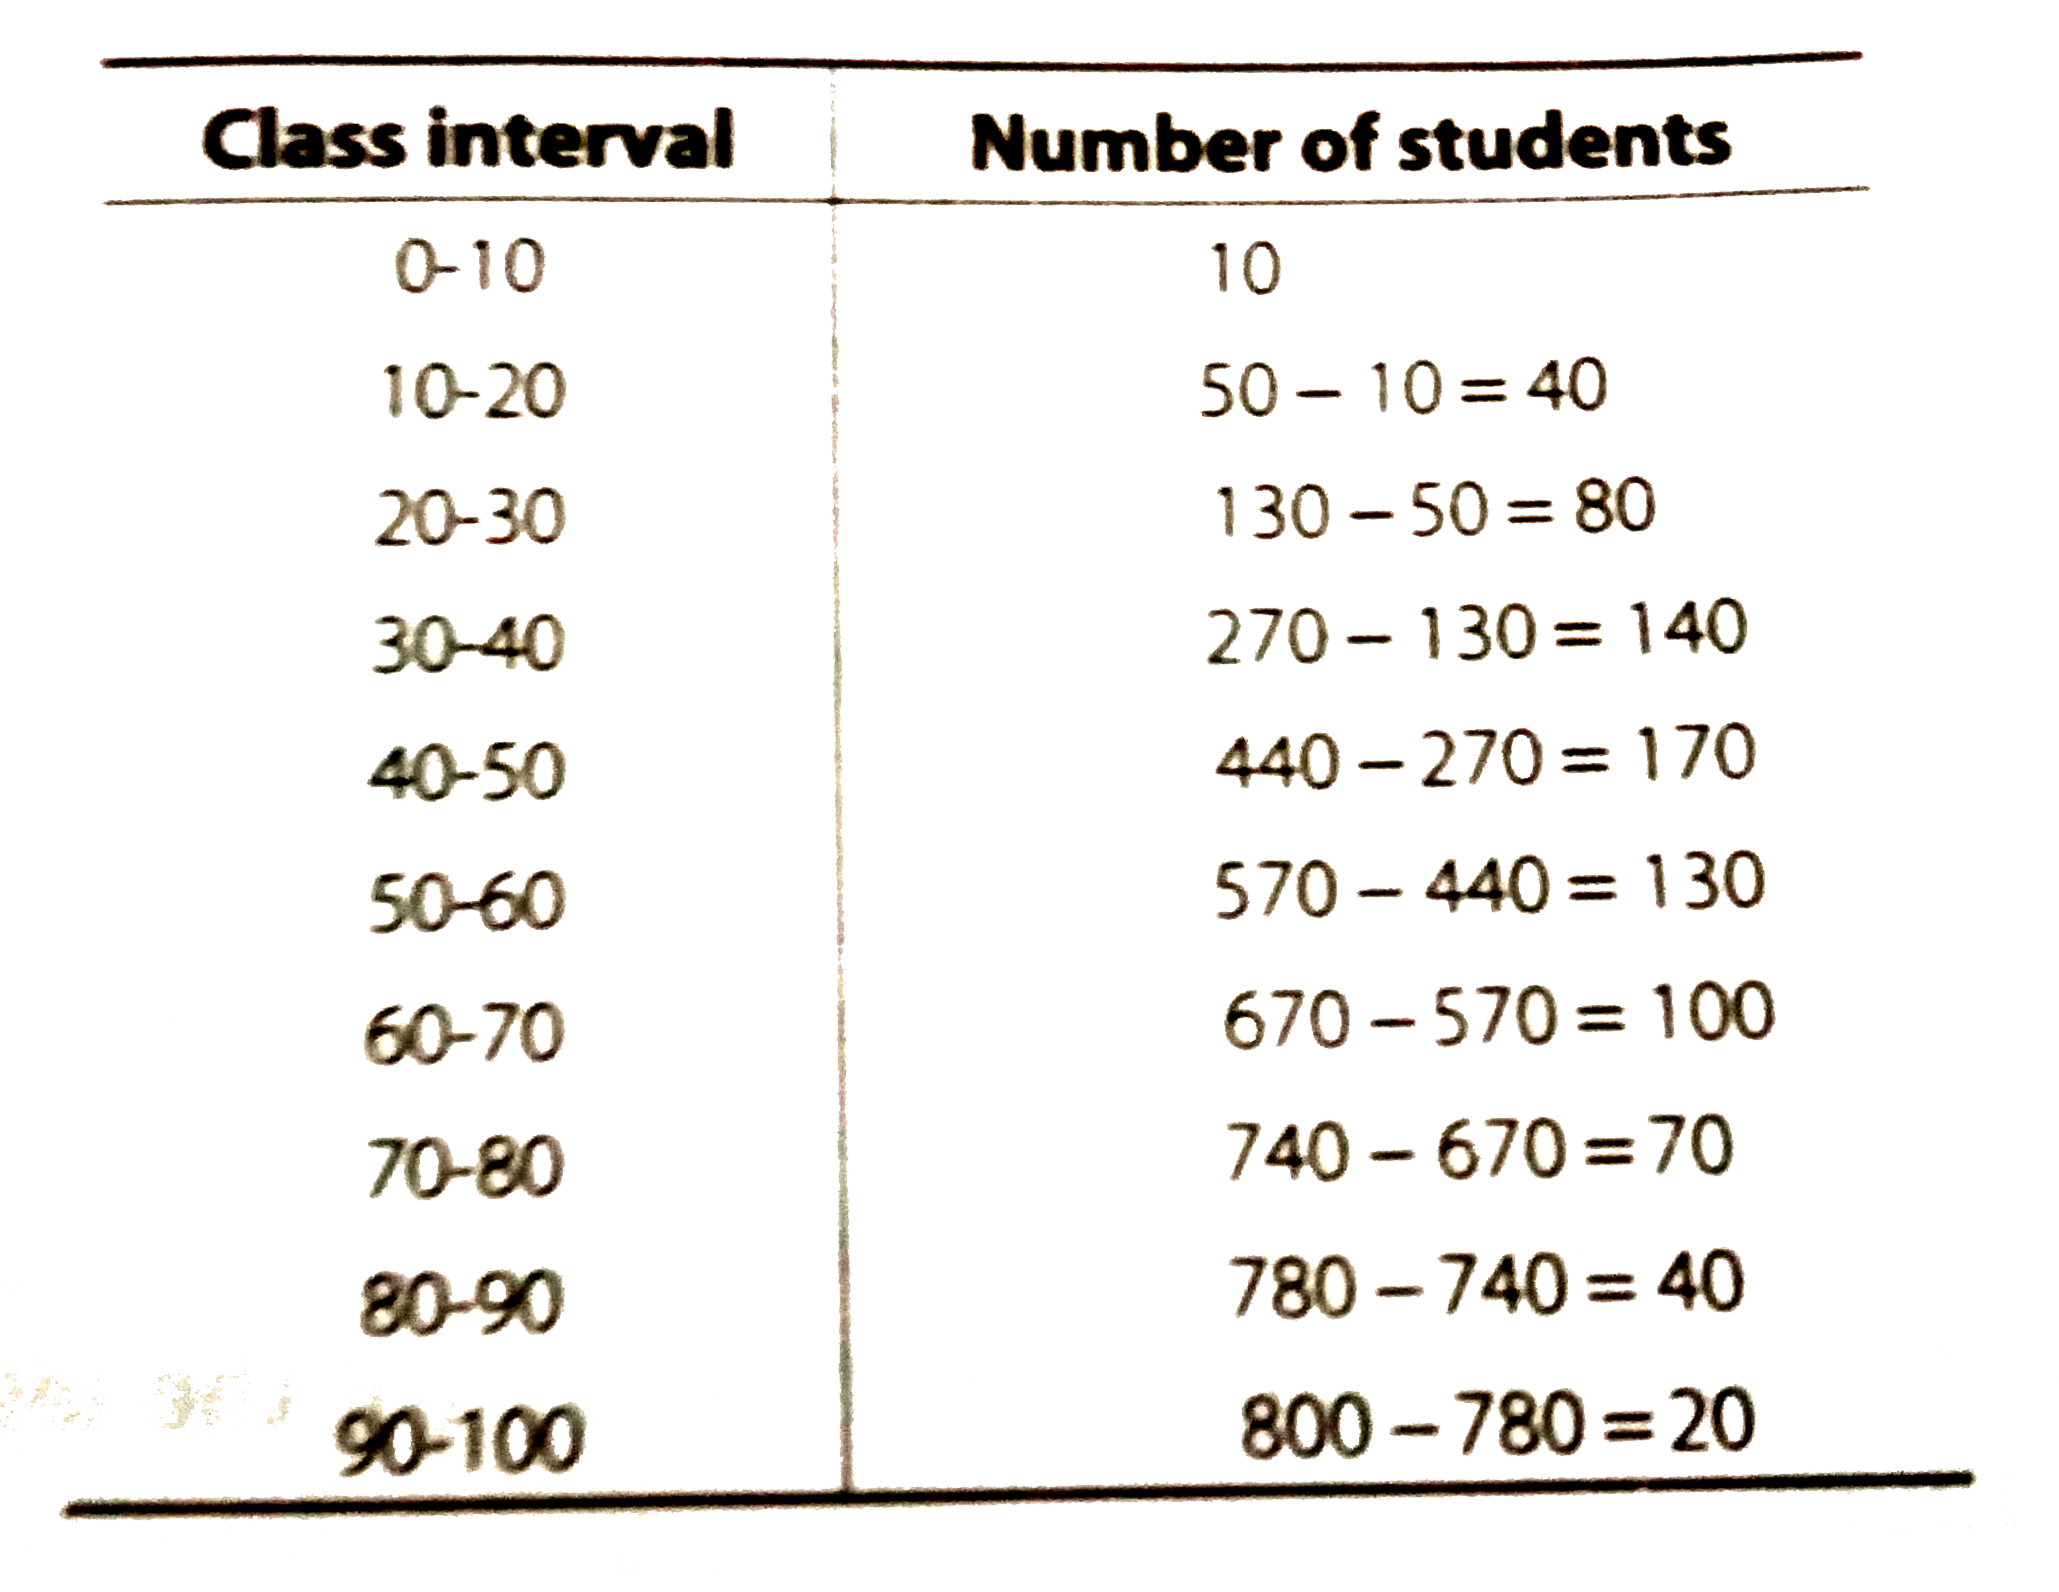
Here, we observe that 10 students have scrored marks below 10 i.e. it lies between class interval 0-10. Similarly, 50 students have scored mark below 20. So, 50-10=40 students lies in the interval 10-20 and so on. The table of a frequency distribution for the given data is

|
Updated on:21/07/2023
Topper's Solved these Questions
- BOOK - NCERT EXEMPLARCHAPTER - STATISTICS AND PROBABILITYEXERCISE - VERY SHORT ANSWERS QUESTIONS2videos
STATISTICS AND PROBABILITY
- BOOK - NCERT EXEMPLARCHAPTER - STATISTICS AND PROBABILITYEXERCISE - LONG ASWERS QUESTIONS5videos
STATISTICS AND PROBABILITY
- BOOK - NCERT EXEMPLARCHAPTER - REAL NUMBERSEXERCISE - Real Numbers39videos
REAL NUMBERS
- BOOK - NCERT EXEMPLARCHAPTER - SURFACE AREAS AND VOLUMESEXERCISE - Surface Areas And Volumes62videos
SURFACE AREAS AND VOLUMES
Similar Questions
Knowledge Check
- Question 1 - Select One
A graph of a cumulative frequency distribution function is known as
AOgiveBHistogramCHistorigramDFrequency Polygon - Question 2 - Select One
In 'Less than' cumulative frequency distribution the omitted limit is
ALowerBUpperCMiddleDNone of these
Given below is a cumulative frequency distribution showing the mars secured by 50 students of a class

From the frequency distribution table for the data.View SolutionConstruction of Cumulative frequency distribution
View SolutionForm the frequency distribution table from the following data:
Construct the frequency distribution table for the above data.
 View Solution
From the frequency distribution table from the following data
 View Solution
Construction of a Grouped frequency distribution
View SolutionThe following table shows frequency distribution of marks secured by 100 students in a particular examination. Find the mean of the marks.
 View Solution

