Find the missing frequencies f1andf2 in the following frequency distribution, if n = 100 and median is is 32
Class frequency (fi)0−10 1010−20 f120−30 2530−40 3040−50 f250−60 10Total 100Solution in Gujrati
The correct Answer is:f1=9andf2=16
Step by step video, text & image solution for Find the missing frequencies f_(1) and f_(2) in the following frequency distribution, if n = 100 and median is is 32 {:("Class ", "frequency " (f_(i))),(0-10," "10),(10-20," "f_(1)),(20-30," "25),(30-40," "30),(40-50," "f_(2)),(50-60," "10),("Total "," "100):} by Maths experts to help you in doubts & scoring excellent marks in Class 10 exams.
Updated on:21/07/2023Topper's Solved these Questions
- STATISTICSBOOK - KUMAR PRAKASHANCHAPTER - STATISTICSEXERCISE - Exercise 14.1
9 Videos
- STATISTICSBOOK - KUMAR PRAKASHANCHAPTER - STATISTICSEXERCISE - Exercise 14.2
6 Videos
- STATISTICSBOOK - KUMAR PRAKASHANCHAPTER - STATISTICSEXERCISE - Objective Questions (True or false)
5 Videos
- SOME AAPLICATIONS OF TRIGONOMETRYBOOK - KUMAR PRAKASHANCHAPTER - SOME AAPLICATIONS OF TRIGONOMETRYEXERCISE - Objective Questions
24 Videos
- SURFACE AREAS AND VOLUMESBOOK - KUMAR PRAKASHANCHAPTER - SURFACE AREAS AND VOLUMESEXERCISE - TEST YOUR SKILLS
5 Videos
Similar Questions
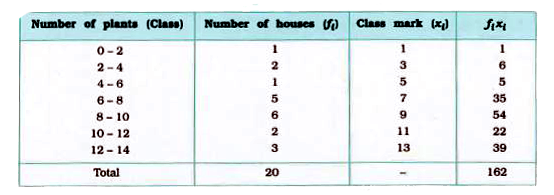
A survey was conducted by a group of students as a part of their environment awareness programme, in which they collected the following data regarding the number of plants in 20 houses in a locality . Find the mean number of plants per house.
Number of plants 0−22−44−66−88−1010−1212−14Number of houses 1 2 1 5 6 2 3
Which method did you use for finding the mean, and why ?

View SolutionThe following table shows the ages of the patients admitted in a hospital during a year :
Age (in years) 5−1515−2525−3535−4545−5555−65Number of patients 6 11 21 23 14 5
Find the mode the mean of the data given above. Compare and interpret the two measures of central tendency.
View SolutionFor any frequency distribution, mean is always greater than mode.
View SolutionA kite is flying at a height of 75m from the level ground, attached to a taut string inclined at 60∘ to the horizontal. Then, the length of the string is …………m
View SolutionThe slant height of a frustum of a cone is 4 m and the perimeter of circular ends are 18 m and 16 m. Find the cost of painting its curved surface at 10 per sq. m.
View SolutionThe mean of the following frequency distribution is 62.8 and the sum of all frequencies is 50. Compute the missing frequencies f_(1) and f_(2):
View SolutionIf the median of the following frequency distribution is 28.5 find the missing frequencies: Class interval: 0-10 10-20 20-30 30-40 40-50 50-60 Total Frequency: 5 f1 20 15 f2 5 60
View SolutionWrite the median class of the following distribution: Classes: 0-10 10-20 20-30 30-40 40-50 50-60 60-70 Frequency: 4 4 8 10 12 8 4
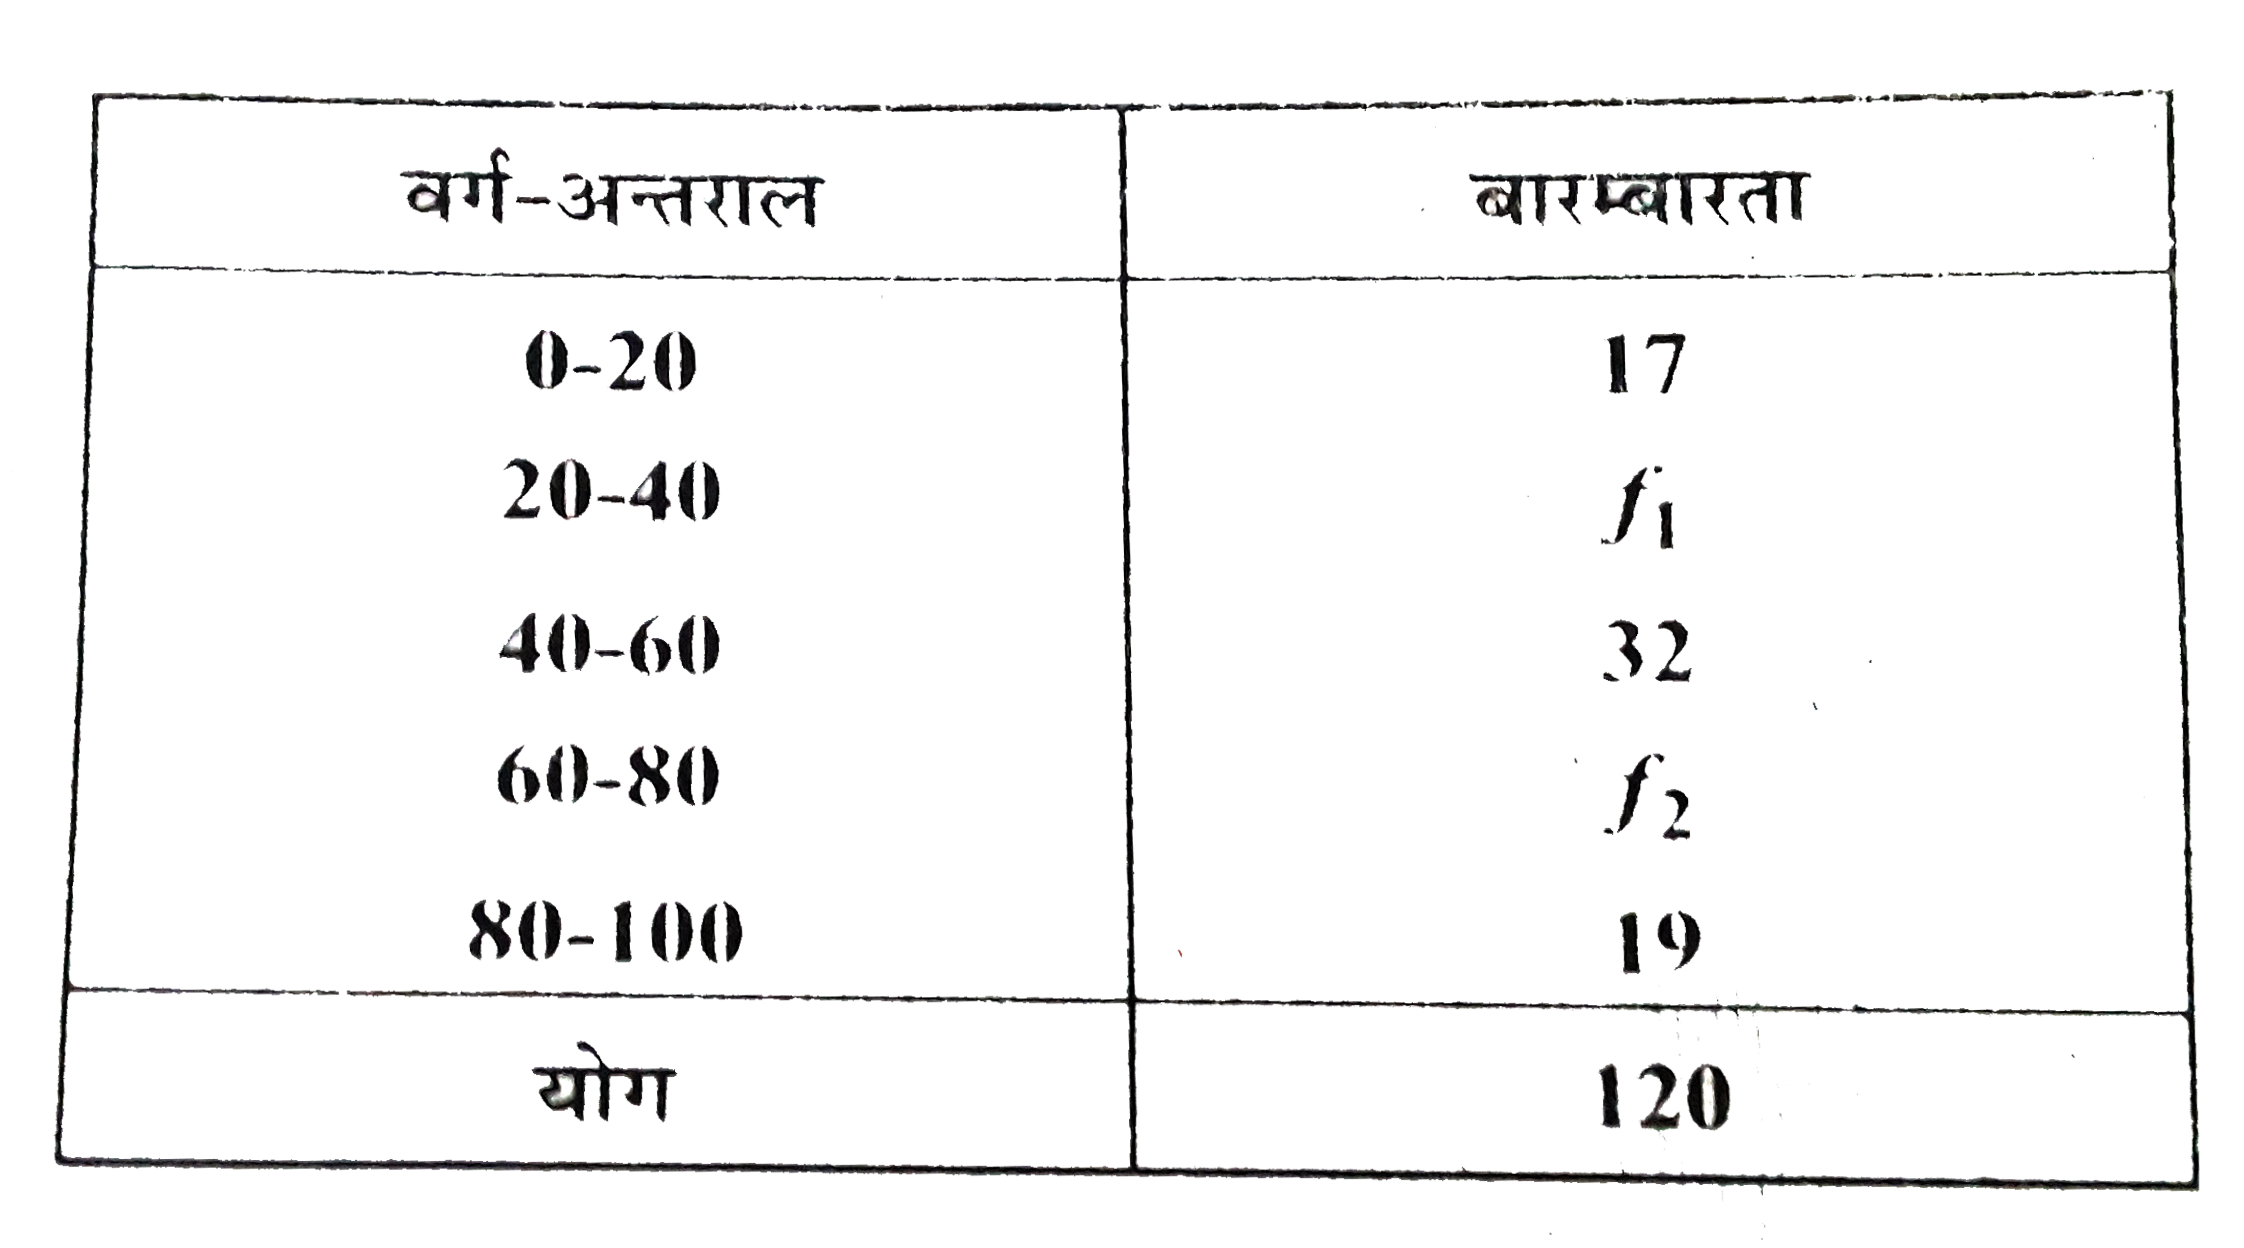
View SolutionFind the missing frequencies in the following frequency distribution if it is known that the mean of the distribution is 50. f=17,f1=32,f2=19 Total 120
View Solutionनिम्नलिखित बारम्बारता बंटन का समान्तर माध्य 50 है । वर्ग अन्तरालों 20-40 तथा 60-80 की अज्ञात बारम्बारताएँ f1 और f2 ज्ञात कीजिए -

View SolutionThe mean of the following frequency distribution is 62.8 and the sum of all frequencies is 50. Compute the missing frequencies f1andf2.

View SolutionThe mean of the following frequency distribution is 57.6 and the number of observation is 50. Find the missing frequency f1&f2

View SolutionFor class 10−20 frequency is 10, 20−30 frequency is 15, 30−40 frequency is 12, 40−50 frequency is 17, then median class is
View SolutionFor class 10−20 frequency is 10, 20−30 frequency is 15, 30−40 frequency is 12, 40−50 frequency is 17, then frequency of median class is
View SolutionThe man of the following frequency distribution is 53 and the sum of all frequencies is 100, compute the missing frequencies f1 and f2.

View SolutionThe maen of the following frequency table is 53. But the frequencies f1 and f2 in the classes 20-40 and 60-80 are missing. Find the missing frequencies.

View Solution
