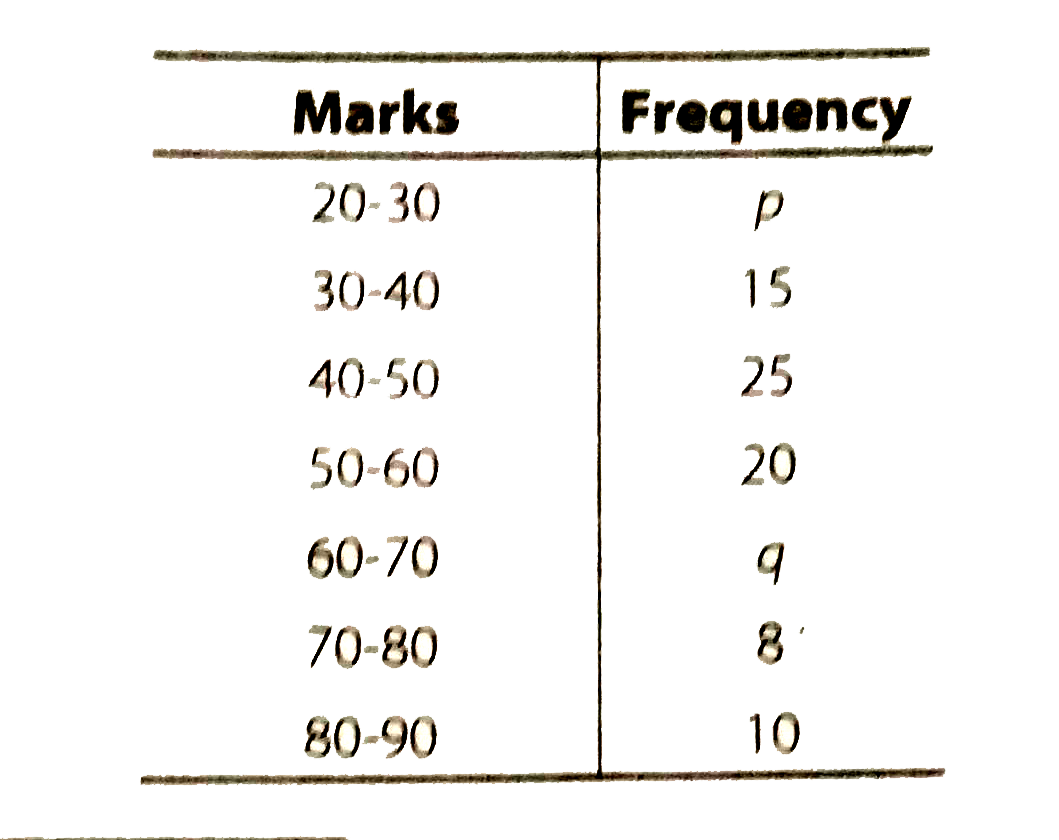
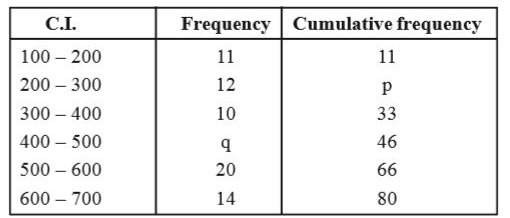
In the following data, find the values of p and q . Also find the median class and the modal class :
Class Frequency (fi) cumulative frequency (cf) 100−200 11 11200−300 12 p300−400 10 33400−500 q 46500−600 20 66600−700 14 80
The correct Answer is:p = 23 , q = 13 , the median class is 400-500 and the modal class is 500-600
Topper's Solved these Questions
- STATISTICSBOOK - KUMAR PRAKASHANCHAPTER - STATISTICSEXERCISE - Exercise 14.1
9 Videos
- STATISTICSBOOK - KUMAR PRAKASHANCHAPTER - STATISTICSEXERCISE - Exercise 14.2
6 Videos
- STATISTICSBOOK - KUMAR PRAKASHANCHAPTER - STATISTICSEXERCISE - Objective Questions (True or false)
5 Videos
- SOME AAPLICATIONS OF TRIGONOMETRYBOOK - KUMAR PRAKASHANCHAPTER - SOME AAPLICATIONS OF TRIGONOMETRYEXERCISE - Objective Questions
24 Videos
- SURFACE AREAS AND VOLUMESBOOK - KUMAR PRAKASHANCHAPTER - SURFACE AREAS AND VOLUMESEXERCISE - TEST YOUR SKILLS
5 Videos
Similar Questions
Knowledge Check
The median of the following data is 50. Find the values of p and q, if the sum of the all the frequencies is 90.
 Ap=5 q=7Bp=2 q=6Cp=3 q=5Dp=5 q=8
Find the mean, mode and median for the following data :
ClassFrequency0−10 810−20 1620−30 3630−40 3440−50 6Total 100
View SolutionFor each of the following frequencies distribution draw histogram :
(1) Profit per shop (Rs.) Number of shops 0−100 12 100−200 18 200−300 27 300−400 20 400−500 17 500−600 6
(2)
View SolutionThe median of the following data is 525. Find the missing frequency, if it is given that there are 100 observations in the data: Class interval Frequency Class interval Frequency 0 100 2 500 600 20 100 200 5 600 700 f2 200 300 f1 700 800 9 300 400 12 800 900 7 400 500 17 900 1000 4
View SolutionThe median of the following data is 525. Find the missing frequency, if it is given that there are 100 observations in the data: Class interval Frequency Class interval Frequency 0 100 2 500 600 20 100 200 5 600 700 f2 200 300 f1 700 800 9 300 400 12 800 900 7 400 500 17 900 1000 4
View SolutionThe median of the following data is 525. Find the values of x and y , if the total frequency is 100 Class interval Frequency 0 100 2 100 200 5 200 300 x 300 400 12 400 500 17 500 600 20 600 700 y 700 800 9 800 900 7 900 1000 4
View SolutionIf the mean of the following distributions 54, find the value of p: Class: 0-20 20-40 40-60 60-80 80-100 Frequency: 7 p 10 9 13
View SolutionIf the mean of the following distribution is 54, find the value of p: Class: 0-20 20-40 40-60 60-80 80-100 Frequency: 7 p 10 9 13
View Solution

