Following table gives the temperature at 12 : 00 noon on seven successive days in a city:

Draw a line graph.
Step by step video & image solution for Following table gives the temperature at 12 : 00 noon on seven successive days in a city: Draw a line graph. by Maths experts to help you in doubts & scoring excellent marks in Class 8 exams.
Updated on:21/07/2023Topper's Solved these Questions
- INTRODUCTION TO GRAPHS Book:MTG IIT JEE FOUNDATIONChapter:INTRODUCTION TO GRAPHS Exercise:NCERT SECTIONS (15.1)
Explore 7 Videos
- INTRODUCTION TO GRAPHS Book:MTG IIT JEE FOUNDATIONChapter:INTRODUCTION TO GRAPHS Exercise:NCERT SECTIONS (15.2)
Explore 6 Videos
- INTRODUCTION TO GRAPHS Book:MTG IIT JEE FOUNDATIONChapter:INTRODUCTION TO GRAPHS Exercise:OLYMPIAD/HOTS CORNER
Explore 5 Videos
- FOOTSTEPS TOWARDS JEE MAINBook:MTG IIT JEE FOUNDATIONChapter:FOOTSTEPS TOWARDS JEE MAINExercise:Section B (Numerical Value Type Questions)
Explore 9 Videos
- LINEAR EQUATIONS IN ONE VARIABLEBook:MTG IIT JEE FOUNDATIONChapter:LINEAR EQUATIONS IN ONE VARIABLEExercise:Olympiad/HOTS Corner
Explore 15 Videos
Similar Questions
Following table gives the temperature at 12:00 noon on seven successive days in a city: Day (November), 1, 2, 3, 4, 5, 6, 7 Temperature (in 0C): , 14, 18, 14, 16, 20, 15, 18 Plot a graph to illustrate this information:
View SolutionThe following table gives the data of number of schools (stage-wise) of a country in the year 2002.
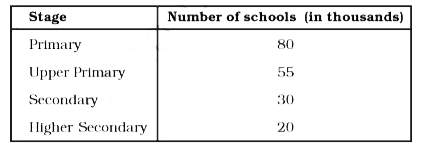
Draw a bar graph to represent the above data:
View Solution
Knowledge Check
The following graph shows the temperature of a patient observed in a hospital at a certain interval of time on a certain day. Starting at 5 A.M.
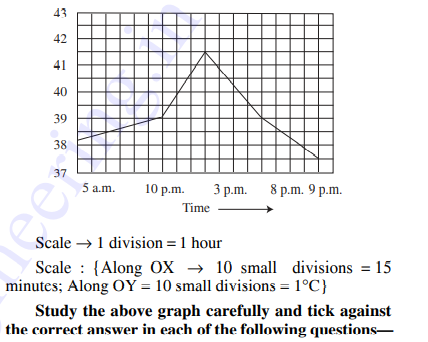
At what time during the day, the temperature was maximum ?A12 P.M.B12.30 P.M.C1 P.M.D1.30 P.M.The following graph shows the temperature of a patient observed in a hospital at a certain interval of time on a certain day. Starting at 5 A.M.
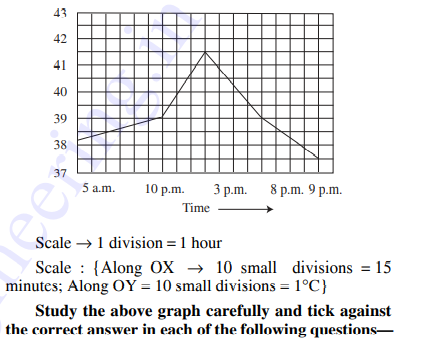
What was the maximum temperature during the day ?A40.7∘CB41.5∘CC40.8∘CD41∘CThe following graph shows the temperature of a patient observed in a hospital at a certain interval of time on a certain day. Starting at 5 A.M.
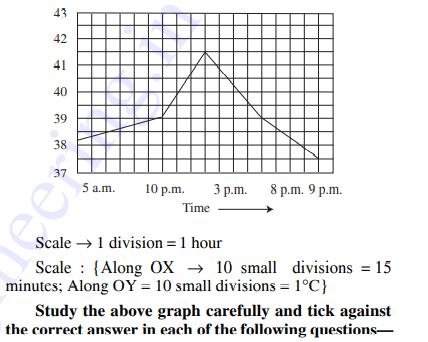
The normal temperature is 37.5∘C . At what time was the temperature normal ?A5 A.M.B5 P.M.C9 P.M.DAt no time
The following table gives the average temperatures, during the year 2006 and 2007. Draw a double bar graph for the given data.

View SolutionThe following table gives the literacy rate (in percentage) of 35 cities. Find the mean literacy rate.
View SolutionThe following table gives the information regarding the number of persons employed to do a piece of work and time taken to complete the work:

Plot the line graph for this information.
View SolutionThe following table gives the information regarding the number of persons employed to a piece of work and time taken to complete the work: No. of persons:, 2, 4, 6, 8 Time taken (in days):, 12, 6, 4, 3 Plot a graph of this information.
View SolutionThe following table represents income of a Gram Panchayat from different sources in a particular year:
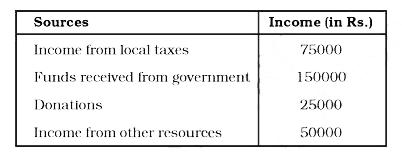
Draw a bar graph to represent the above information
View Solution