Plotting the following points, check which are not forming linear graph?
L(4,2), M(4,3), N(4,6),Q(4,7)
u(2,5), V(2,3), W(2,6), X(2,7)
A(1, 1), B(2, 2), C(3, 3), D(4,4)
R(1, 1), S(2,4), T(3, 2), U(4,1)
To determine which set of points does not form a linear graph, we will follow these steps:
Step 1: Understand the Definition of a Linear Graph
A linear graph is represented by a straight line. This means that if we plot the points on a coordinate plane, they should all lie on a single straight line.
Step 2: List the Given Points
Let's denote the points for each option:
- Option 1: L(4,2), L(4,3), L(4,6), L(4,7)
- Option 2: U(2,5), U(2,3), U(2,6), U(2,7)
- Option 3: A(1,1), B(2,2), C(3,3), D(4,4)
- Option 4: R(1,1), S(2,4), T(3,2), U(4,1)
Step 3: Plot the Points for Each Option
1. Option 1:
- Plot (4,2), (4,3), (4,6), (4,7).
- All points have the same x-coordinate (4), which means they form a vertical line.
2. Option 2:
- Plot (2,5), (2,3), (2,6), (2,7).
- Similar to option 1, all points have the same x-coordinate (2), forming another vertical line.
3. Option 3:
- Plot (1,1), (2,2), (3,3), (4,4).
- These points form a diagonal line, indicating a linear relationship.
4. Option 4:
- Plot (1,1), (2,4), (3,2), (4,1).
- When plotted, these points do not align in a straight line; they form a V shape.
Step 4: Analyze the Plotted Points
- Option 1: Forms a vertical line (linear).
- Option 2: Forms a vertical line (linear).
- Option 3: Forms a diagonal line (linear).
- Option 4: Forms a V shape (not linear).
Step 5: Conclusion
The points in Option 4 do not form a linear graph.
A linear graph is represented by a straight line. This means that if we plot the points on a coordinate plane, they should all lie on a single straight line.
Let's denote the points for each option:
- Option 1: L(4,2), L(4,3), L(4,6), L(4,7)
- Option 2: U(2,5), U(2,3), U(2,6), U(2,7)
- Option 3: A(1,1), B(2,2), C(3,3), D(4,4)
- Option 4: R(1,1), S(2,4), T(3,2), U(4,1)
1. Option 1:
- Plot (4,2), (4,3), (4,6), (4,7).
- All points have the same x-coordinate (4), which means they form a vertical line.
2. Option 2:
- Plot (2,5), (2,3), (2,6), (2,7).
- Similar to option 1, all points have the same x-coordinate (2), forming another vertical line.
- Plot (1,1), (2,2), (3,3), (4,4).
- These points form a diagonal line, indicating a linear relationship.
- Plot (1,1), (2,4), (3,2), (4,1).
- When plotted, these points do not align in a straight line; they form a V shape.
- Option 1: Forms a vertical line (linear).
- Option 2: Forms a vertical line (linear).
- Option 3: Forms a diagonal line (linear).
- Option 4: Forms a V shape (not linear).
The points in Option 4 do not form a linear graph.
Topper's Solved these Questions
- BOOK - MTG IIT JEE FOUNDATIONCHAPTER - INTRODUCTION TO GRAPHS EXERCISE - EXERCISE (INTEGER/NUMERICAL VALUE TYPE)5videos
INTRODUCTION TO GRAPHS
- BOOK - MTG IIT JEE FOUNDATIONCHAPTER - FOOTSTEPS TOWARDS JEE MAINEXERCISE - Section B (Numerical Value Type Questions)9videos
FOOTSTEPS TOWARDS JEE MAIN
- BOOK - MTG IIT JEE FOUNDATIONCHAPTER - LINEAR EQUATIONS IN ONE VARIABLEEXERCISE - Olympiad/HOTS Corner15videos
LINEAR EQUATIONS IN ONE VARIABLE
Similar Questions
Knowledge Check
- Question 1 - Select One
Which of the following plot will not be linear ?
APlot of logxm versus PBPlot of Px/m versus PCPlot of mx versus 1PDPlot of logmx versus log P - Question 2 - Select One
When the boiling points of the first ten normal alkanes are plotted the graph looks like:
A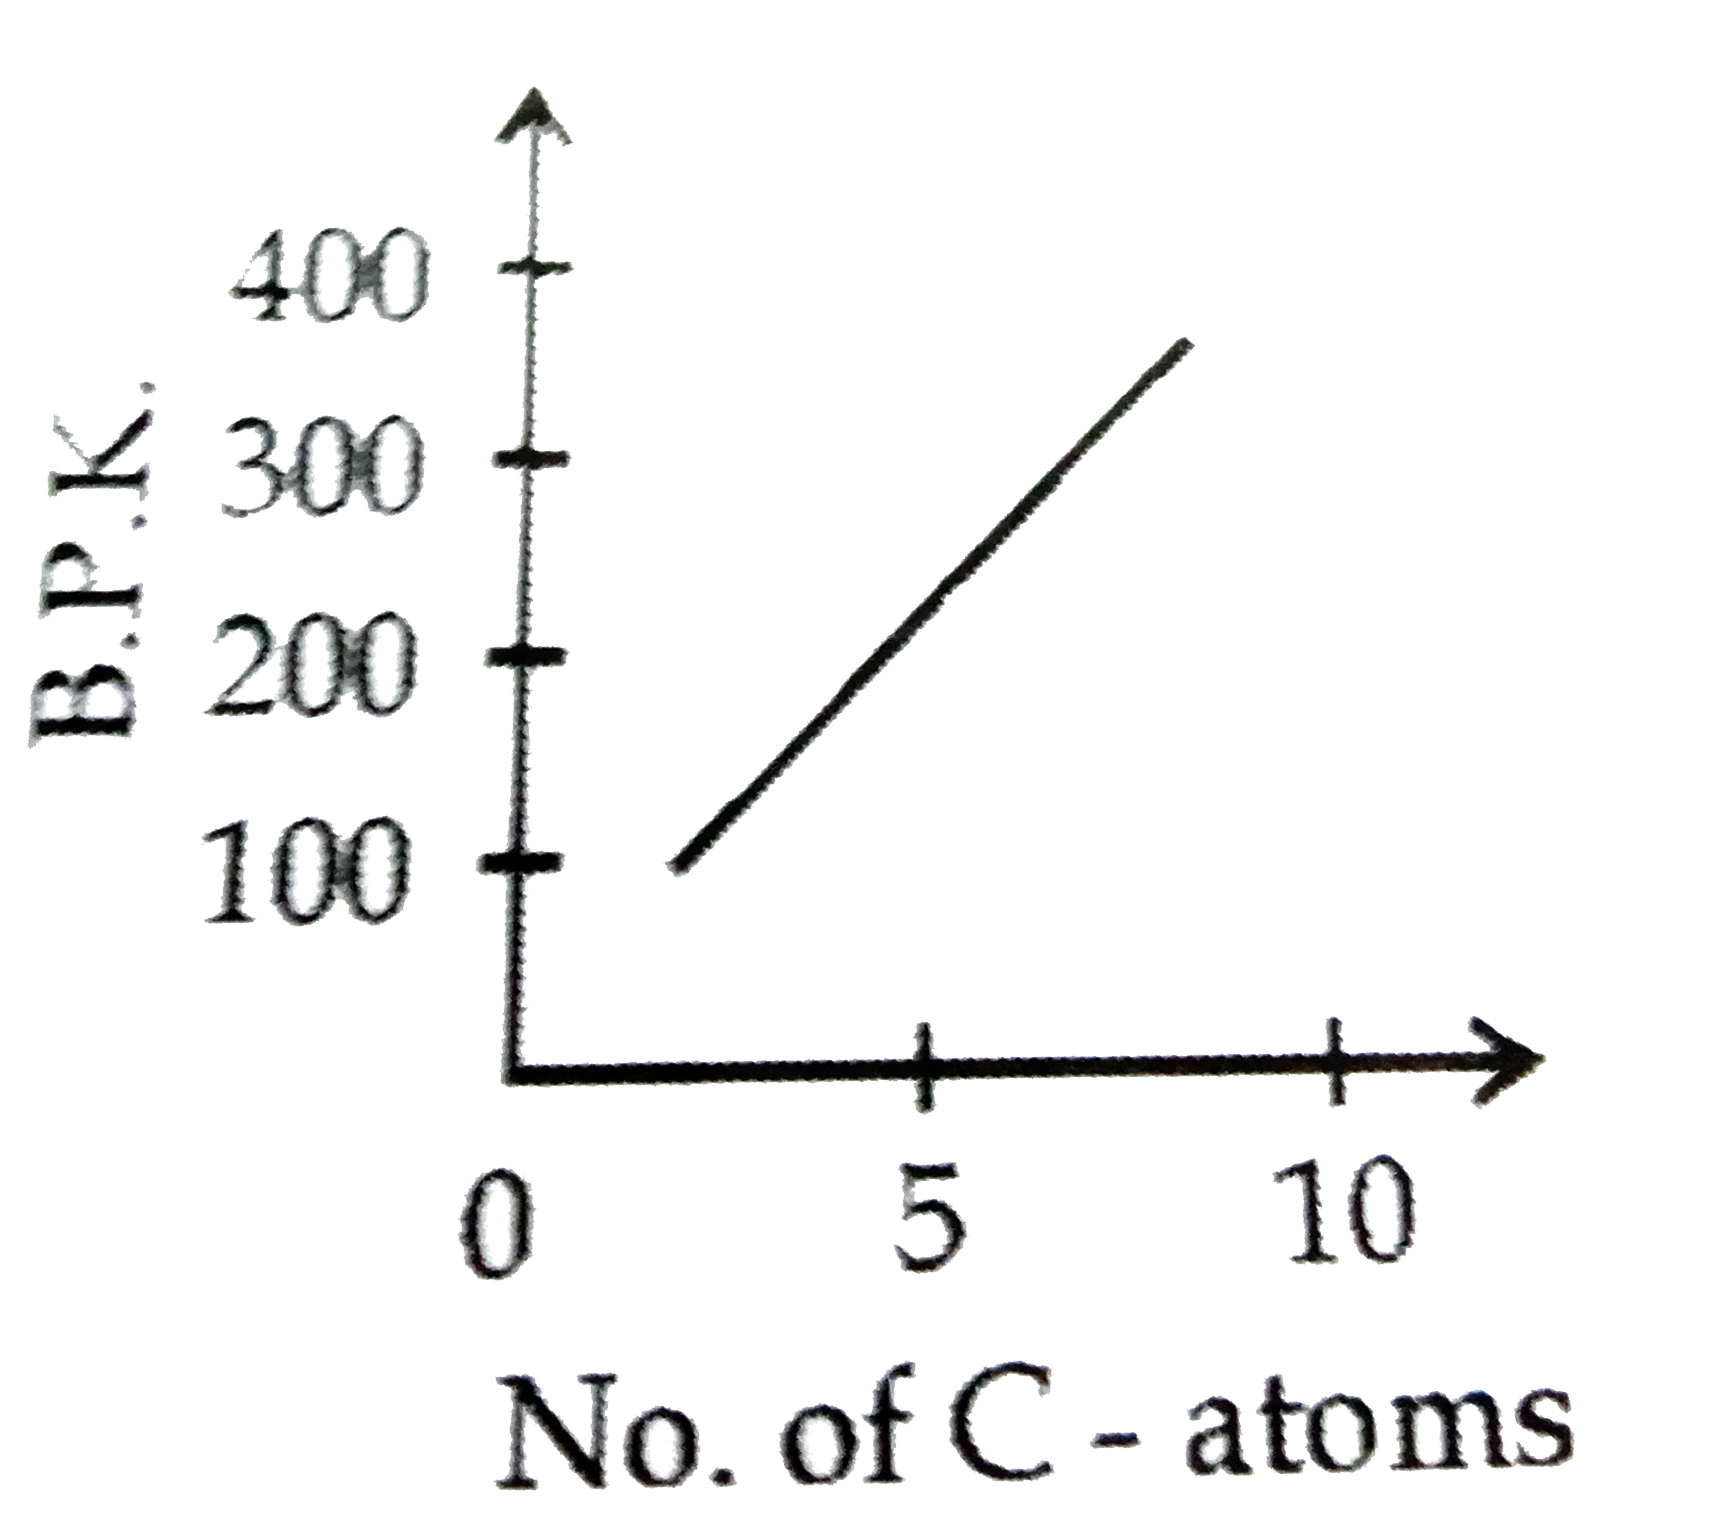 B
B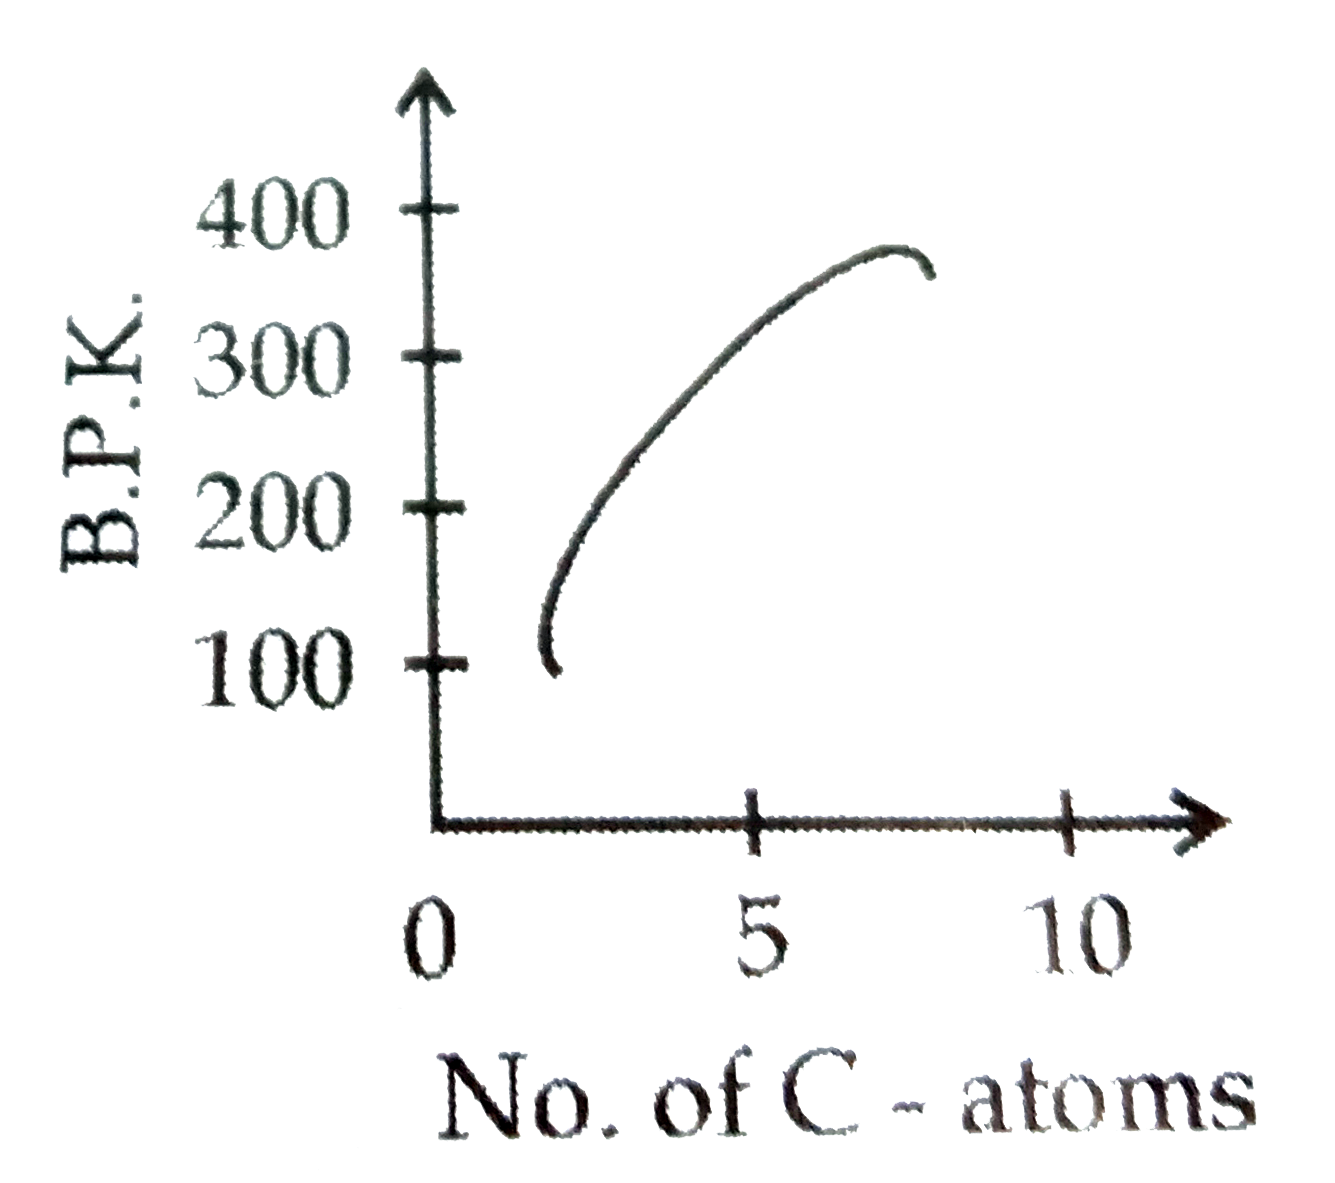 C
C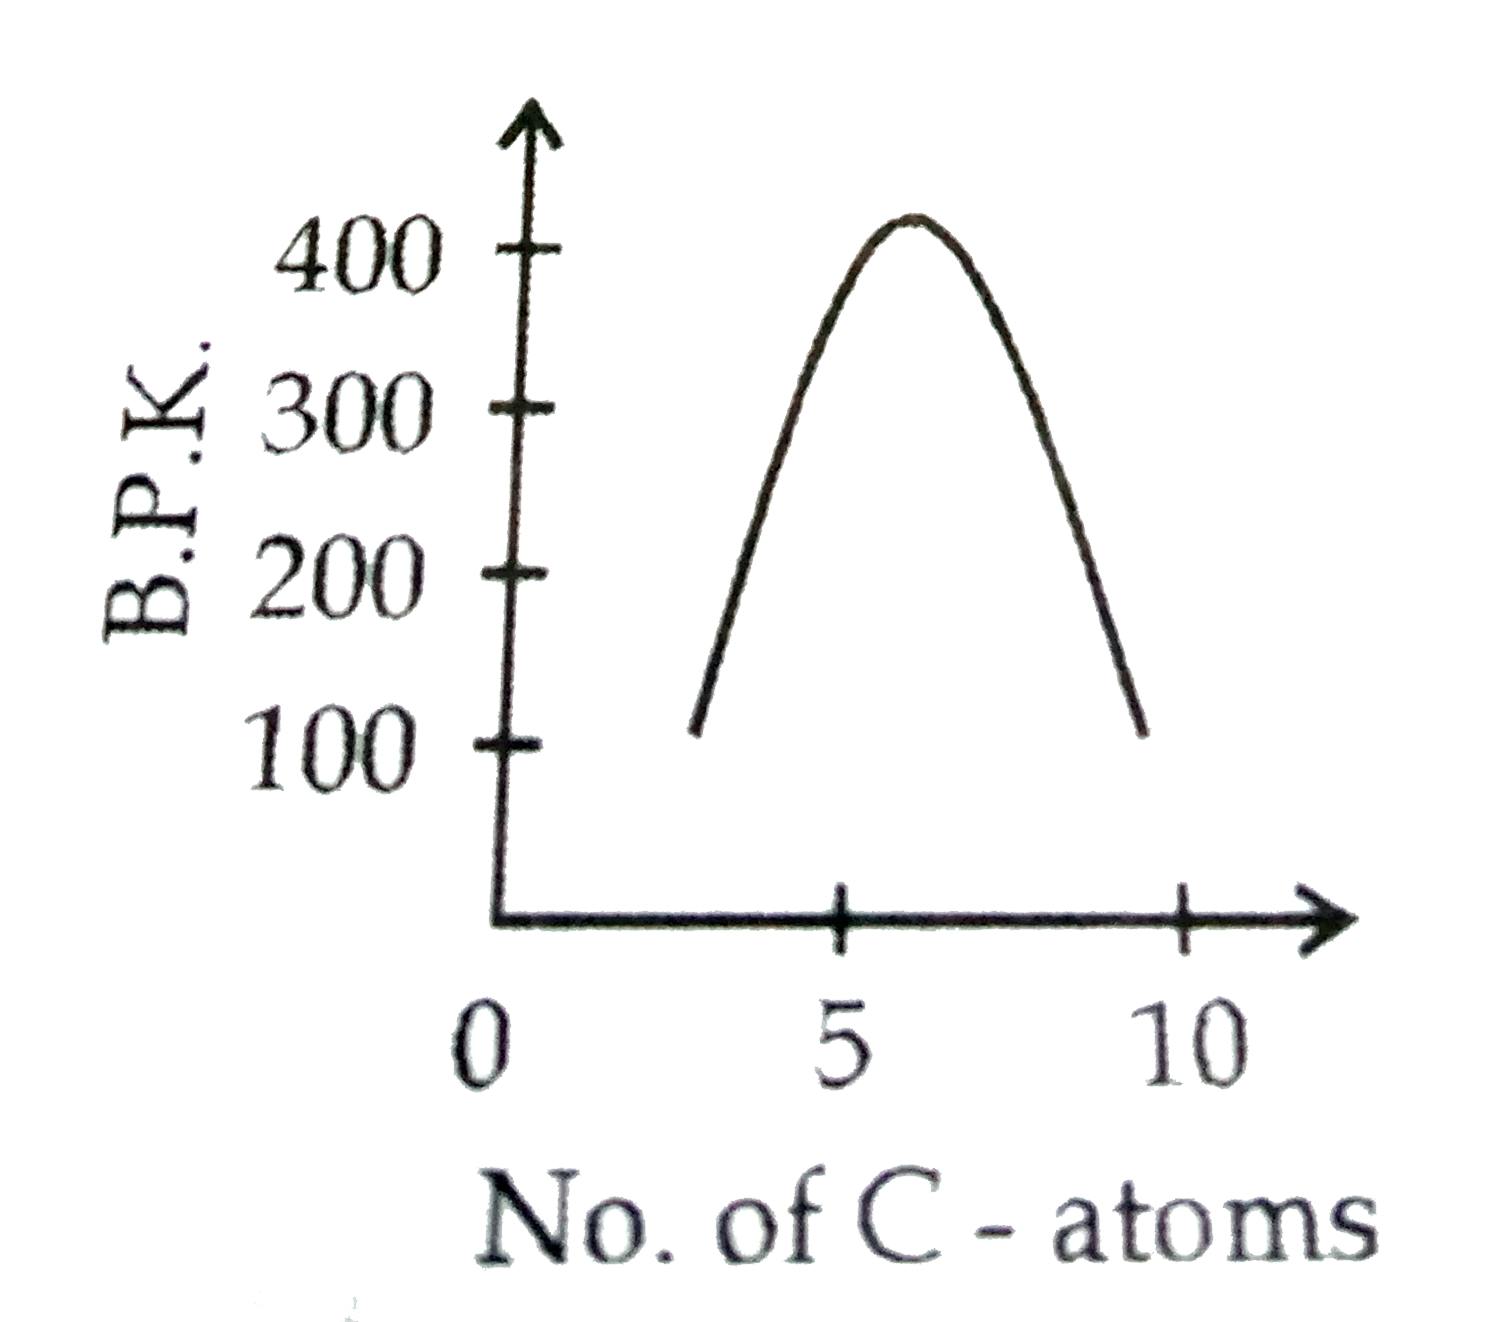 D
D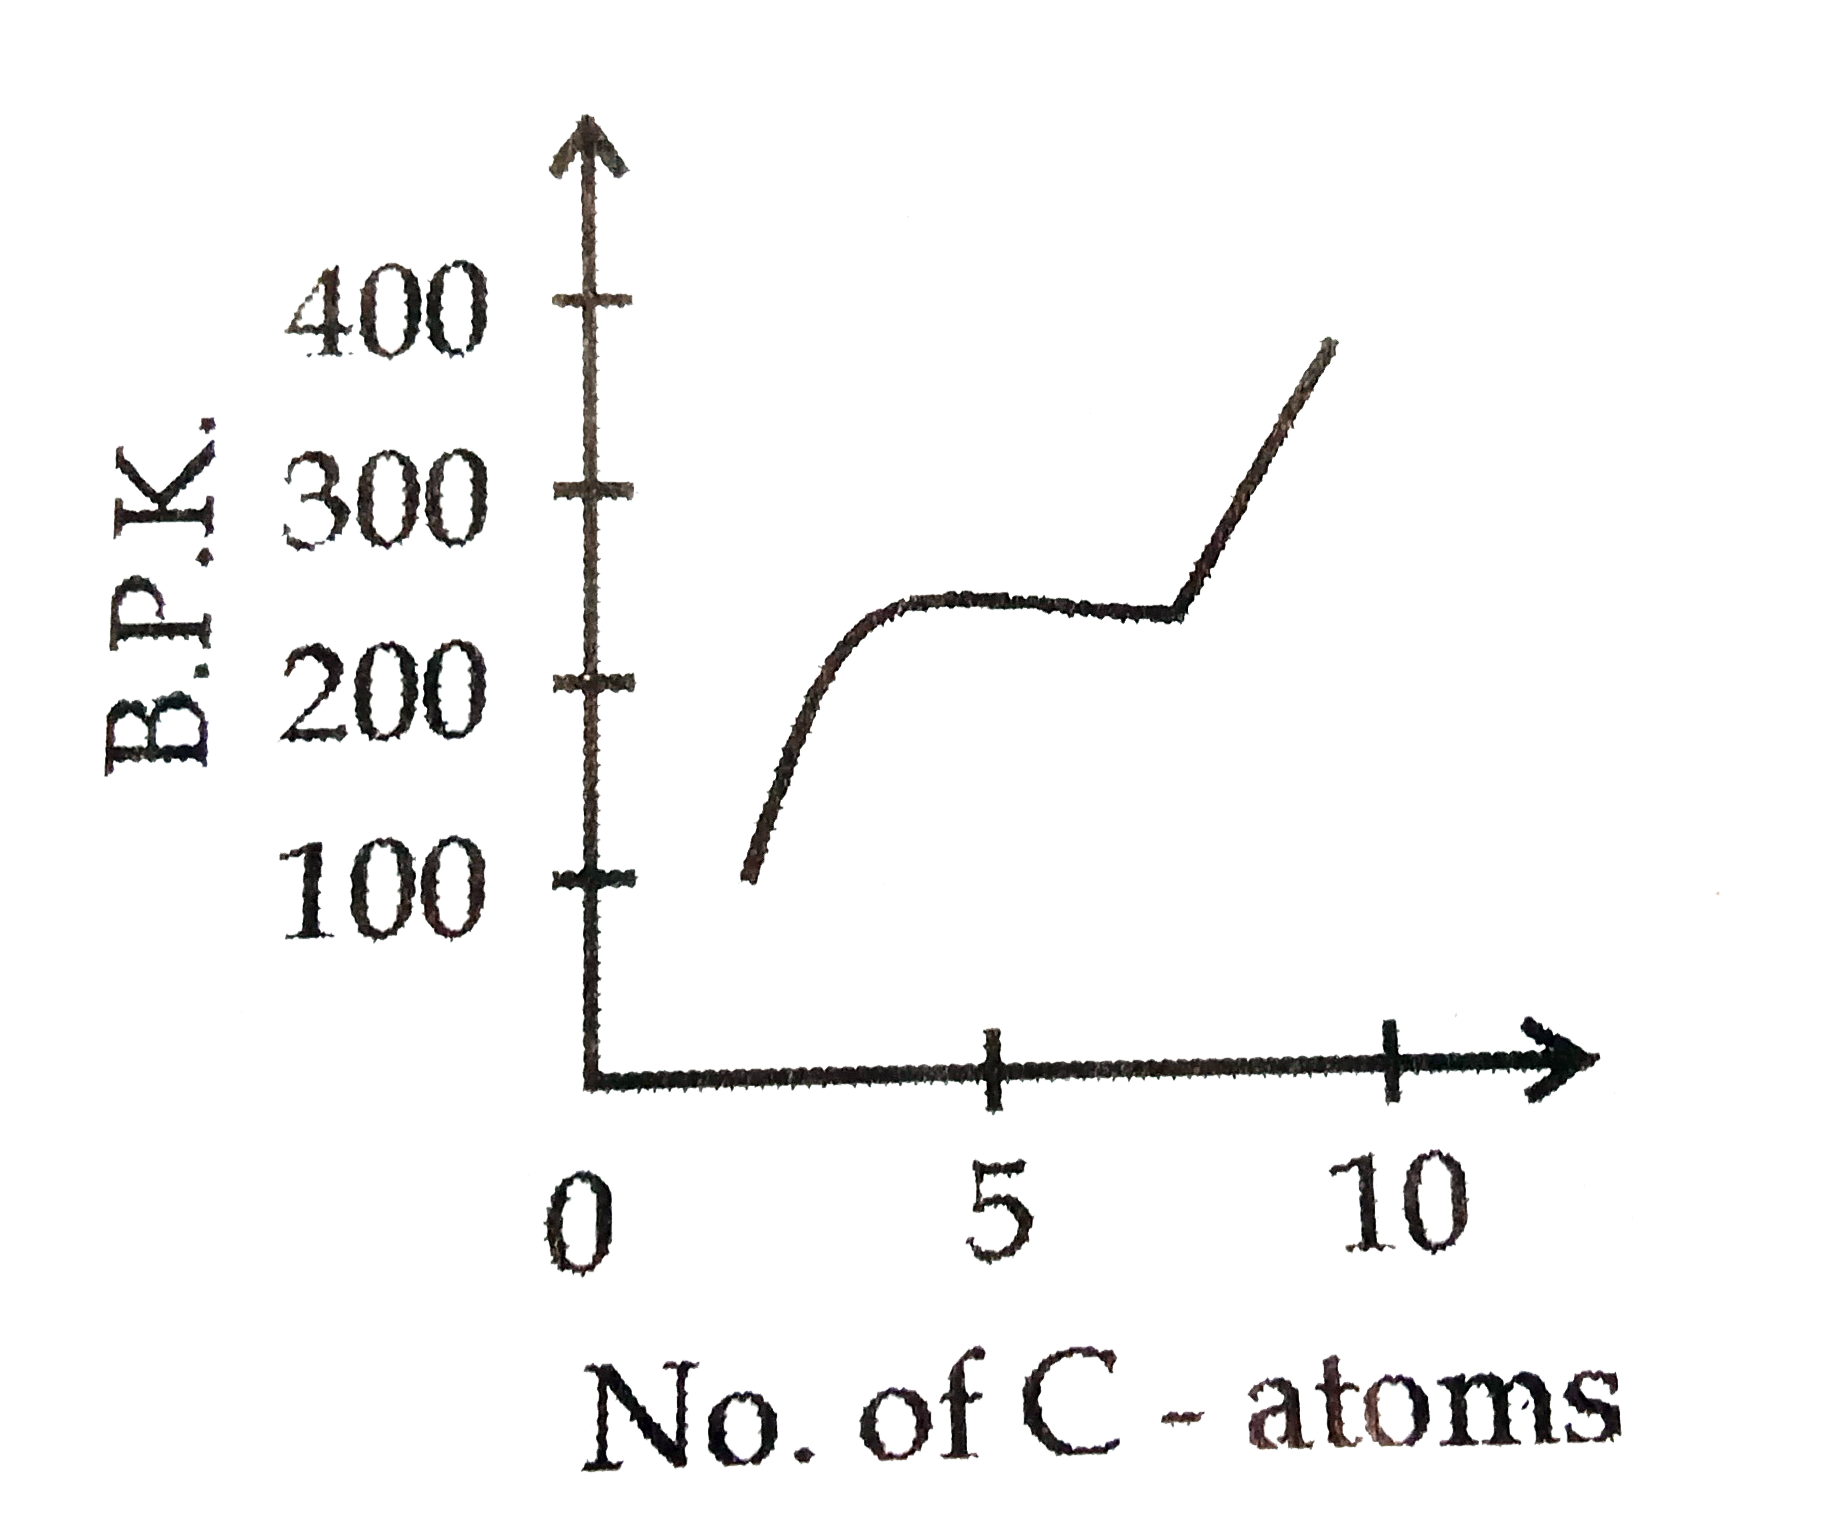
Draw a graph for the following:

Is it a linear graph?
(ii)
Is it a linear graph?View SolutionPlot the following points on a graph sheet and join them in order P(-6,4),Q(-4,-3),R(5,-3),S(2,4). Also, mention the quadrants in which the points lie.
View SolutionWithout plotting the points on the graph , state in which quadrant or on which axis do the following points lie :
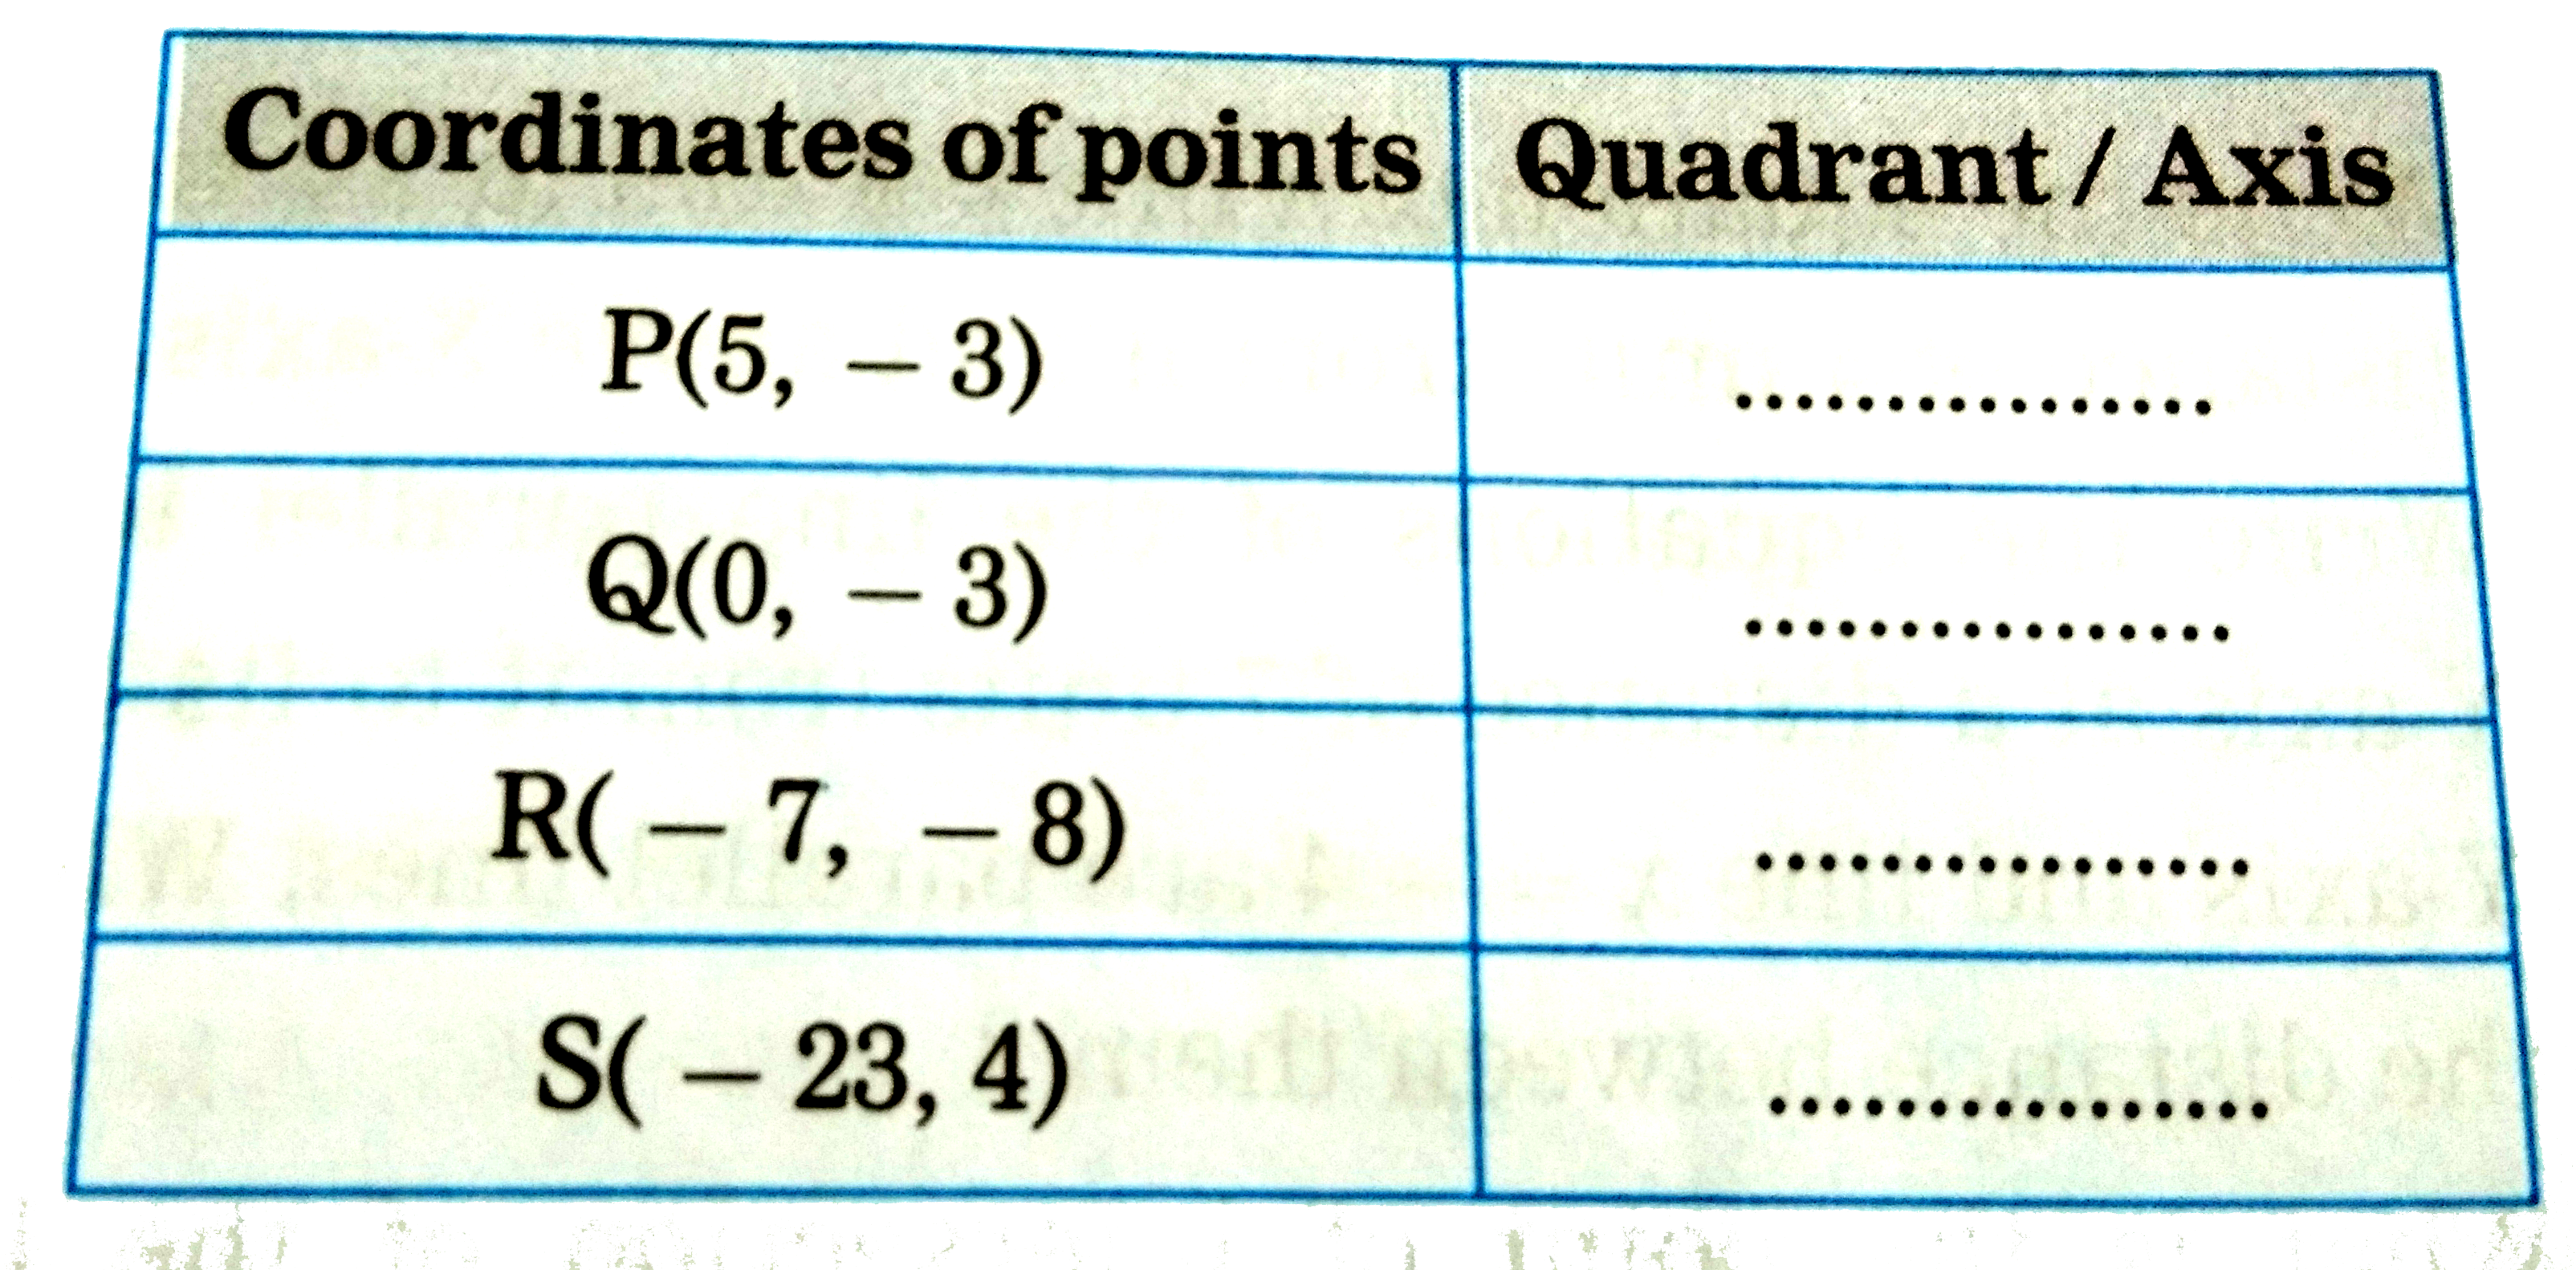 View Solution
Plot the following points on a graph sheet. Verify if they lie on a line
P(1,1) , Q(2,2) ,R(3,3) ,S(4,4)View SolutionPlot the following points on a graph sheet. Verify if they lie on a line
A(4,0) , B(4,2) ,C(4,6) ,D(4,2.5)View SolutionPlot the following points on a graph sheet. Verify if they lie on a line
K(2,3) , L(5,3) ,M(5,5) ,N(4,25)View Solution

