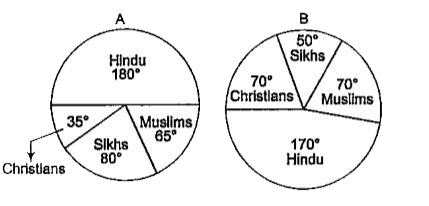
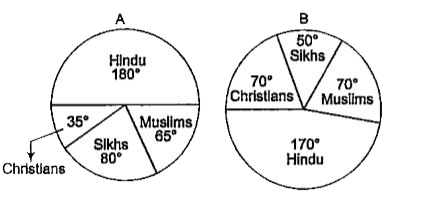
Following two pie diagrams show the religion distribution of workers in two states.
If the population of the state B is 540000, then the Muslims population is
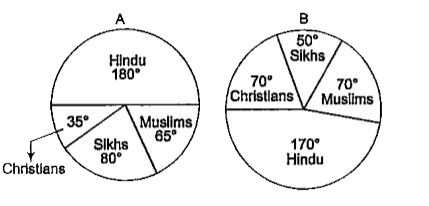
105000
5400
36000
70000
The correct Answer is:A
Step by step video, text & image solution for Following two pie diagrams show the religion distribution of workers in two states. If the population of the state B is 540000, then the Muslims population is by Maths experts to help you in doubts & scoring excellent marks in Class 12 exams.
Updated on:21/07/2023Topper's Solved these Questions
- STATISTICS BOOK - ARIHANT PUBLICATION JHARKHANDCHAPTER - STATISTICS EXERCISE - Exam Booster for Cracking Exam
25 Videos
- SOLVED PAPER 2019BOOK - ARIHANT PUBLICATION JHARKHANDCHAPTER - SOLVED PAPER 2019EXERCISE - SECTION I: MATHEMATICS
48 Videos
- TAXATION BOOK - ARIHANT PUBLICATION JHARKHANDCHAPTER - TAXATION EXERCISE - EXAM BOOSTER
14 Videos
Similar Questions
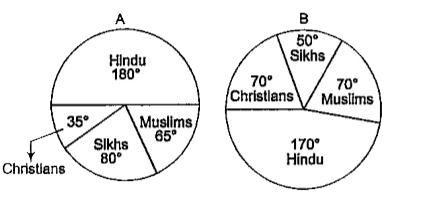
Following two pie diagrams show the religion were distribution of workers in two states.
The percentage difference between Hindu population in state A and Muslims population in state B is
View SolutionRead the following pie diagrams carefully and answer the questions that follow . Following two pie diagrams show the religion were distribution of workers in two states.

The percentage difference between Hindu population in state A and Muslims population in state B is
View Solution
Knowledge Check
Read the following pie diagrams carefully and answer the questions that follow . Following two pie diagrams show the religion were distribution of workers in two states.

If the population of the state B is 540000, then the Muslims population isA105000B540000C36000D70000Read the following pie diagrams carefully and answer the questions that follow . Following two pie diagrams show the religion were distribution of workers in two states.
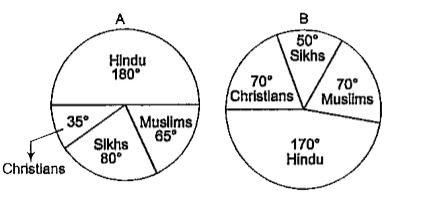
The percentage difference between Christians population in state A and Sikha population in state B isA4.17B0.15C0.3D0.45Read the following pie diagrams carefully and answer the questions that follow . Following two pie diagrams show the religion were distribution of workers in two states.

The percentage difference between Christians population in state A and Sikha population in state B isA4.17%B15%C30%D45%
Read the following pie diagrams carefully and answer the questions that follow . Following two pie diagrams show the religion were distribution of workers in two states.
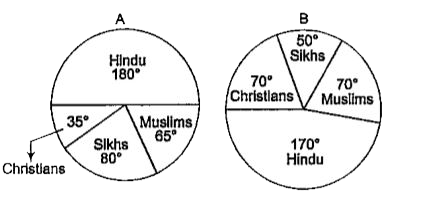
The percentage difference between Sikh population in the two states is
View SolutionRead the following pie diagrams carefully and answer the questions that follow . Following two pie diagrams show the religion were distribution of workers in two states.

The percentage difference between Sikh population in the two states is
View SolutionRead the following pie diagrams carefully and answer the questions that follow . Following two pie diagrams show the religion were distribution of workers in two states.
The percentage of Muslims in state B is
View SolutionRead the following pie diagrams carefully and answer the questions that follow . Following two pie diagrams show the religion were distribution of workers in two states.

The percentage of Muslims in state B is
View SolutionRead the following pie diagrams carefully and answer the questions that follow . Following two pie diagrams show the religion were distribution of workers in two states.
The percentage of Hindus in state A is
View Solution
