For the given distribution showing the number of runs scored by 50 batsmen. Extimate the mode of the data :

4100
4200
4400
4600
The correct Answer is:D
Step by step video & image solution for For the given distribution showing the number of runs scored by 50 batsmen. Extimate the mode of the data : by Maths experts to help you in doubts & scoring excellent marks in Class 10 exams.
Updated on:21/07/2023Topper's Solved these Questions
Similar Questions
The given distribution shows the number of runs scored by some top batsmen of the world in one-day international cricket matches.

Find the mode of the data.
View SolutionThe given distribution shows the number of runs scored by some top batsmen of the world in one-day international cricket matches.Find the mode of the data.
View Solution
Knowledge Check

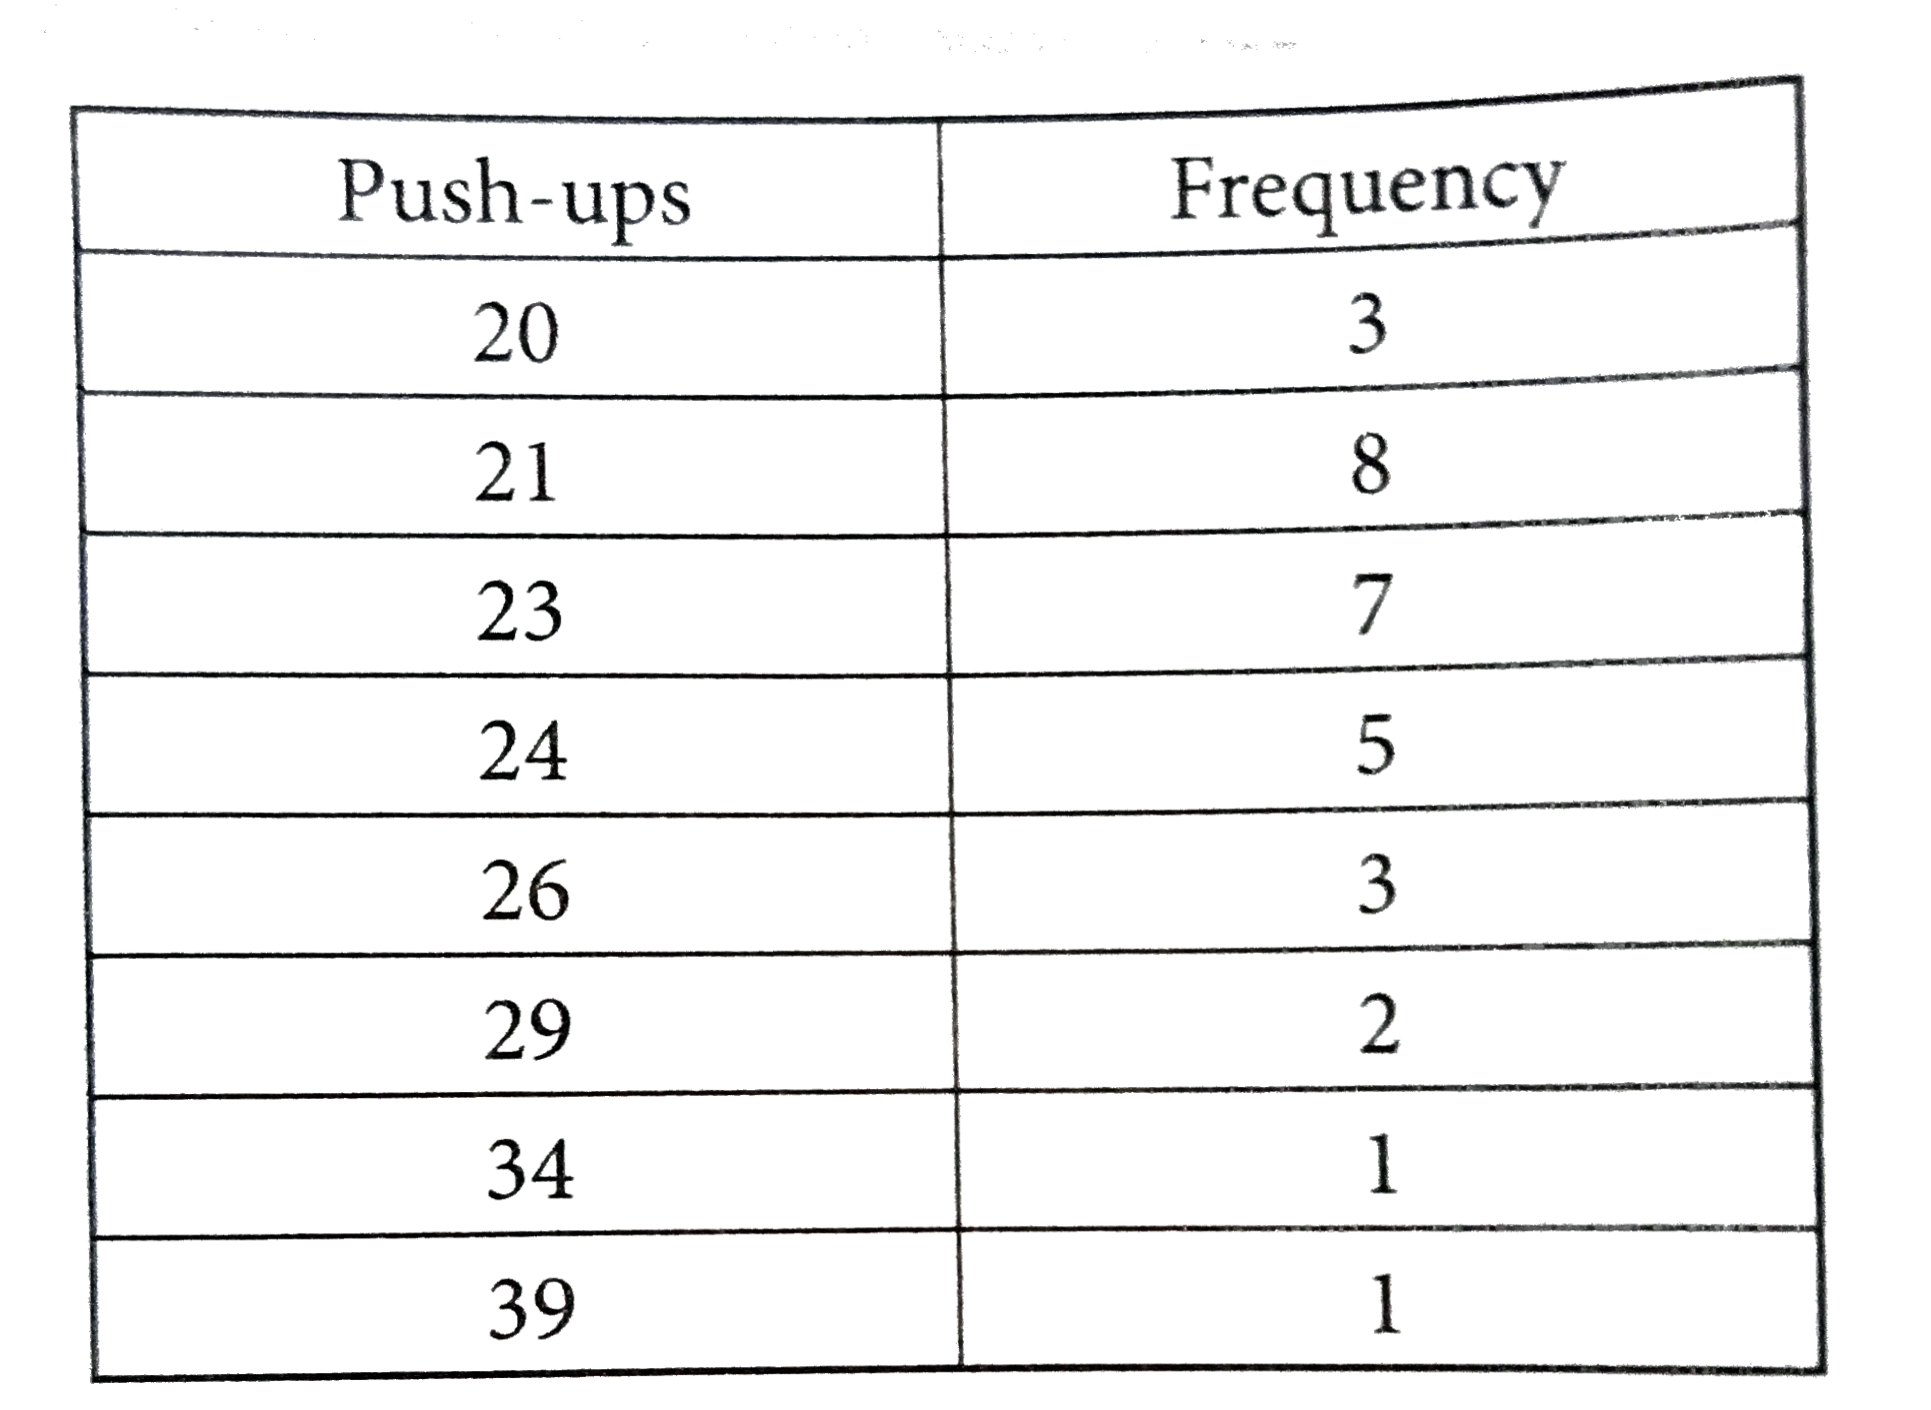
The table above shows the distribution of the number of push ups completed by 30 people in a high school gym class. Which of the following is true the mean, mode, and the range of the numbers of push ups completed?AMean<Range<modeBMode<Range<MeanCRange<Mean<ModeDRange<Mode<Mean
The given distribution shows the number of runs scored by some top batsmen of the world in one-day international cricket matches. Runs scored 3000-4000 4000-5000 5000-6000 6000-7000 7000-8000 8000-9000 9000-10000 10000-11000 No. of batsmen 4 18 9 7 6 3 1 1. Find the mode of the data.
View SolutionGiven below is a cumulative frequency distribution showing the mars secured by 50 students of a class

From the frequency distribution table for the data.
View SolutionThe following distribution shows the transport expenditure of 100 exployees :

Find the mode of the distribution.
View SolutionConsider the frequency distribution of the given number

If the mean is known to be '3', then the value of f is
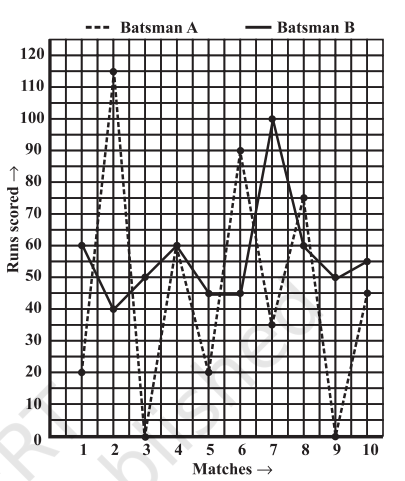
View Solution(A graph on “performance”)The given graph (Fig 15.7) represents the total runs scored by two batsmen A and B, during each of the ten different matches in the year 2007. Study the graph and answer the following questions.(i) What information is given on the two axes?(ii) Which line shows the runs scored by batsman A?(iii) Were the run scored by them same in any match in 2007? If so, in which match?(iv) Among the two batsmen, who is steadier? How do you judge it?

View SolutionThe distribution given below, shows the marks obtained by 25 students in an aptitude test. Find the median and mode of the distribution.
View SolutionThe score on a trivia game is obtained by subtracting the number of incorrect answers from twice the number of correct answers. If a player answered 40 questions and obtained a score of 50, how many questions did the player answer correctly?
View Solution
