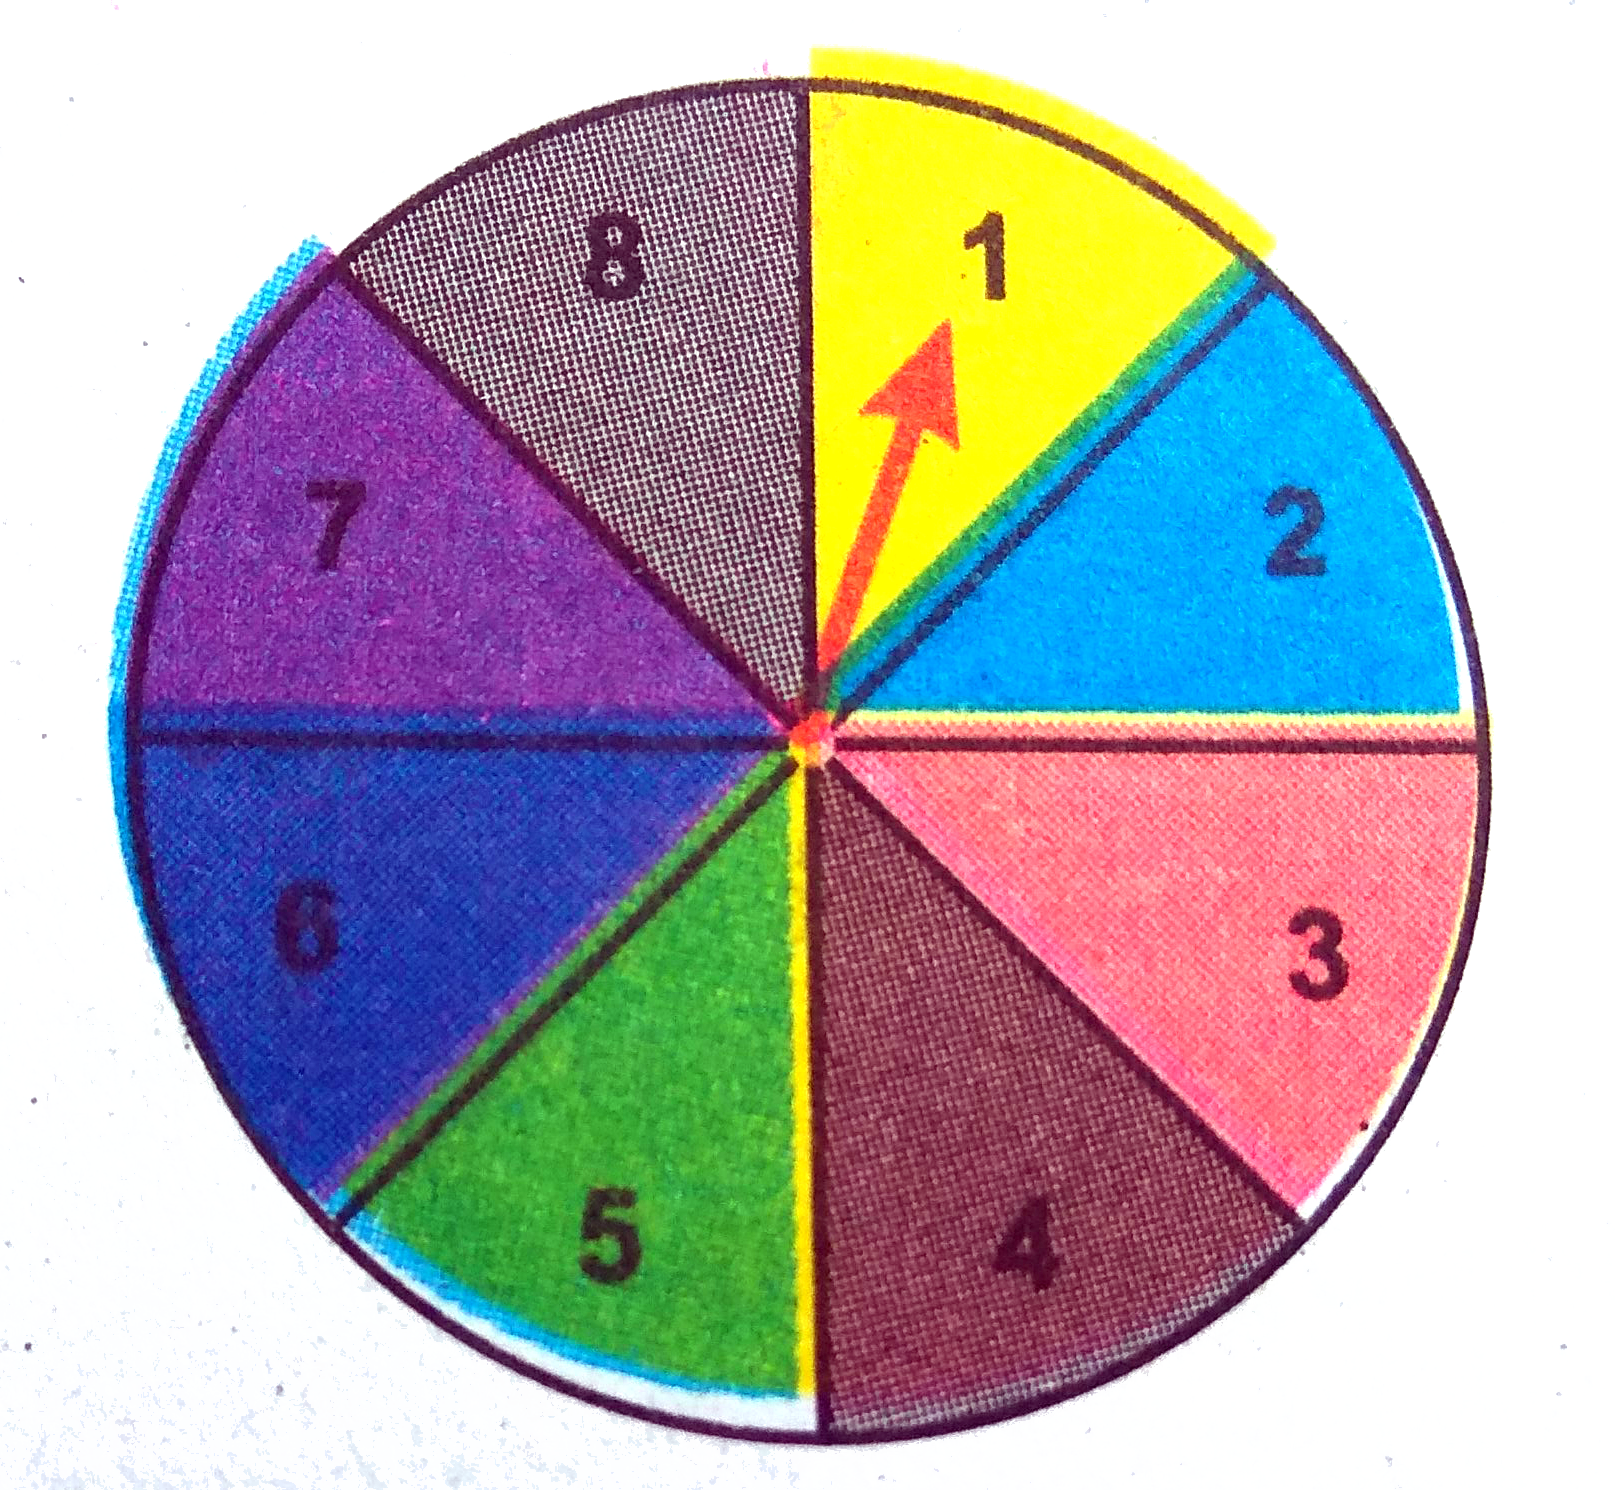
Frame two problems in calculating probability, based on the spinner shown here.
 Solution in Tamil
Step by step video & image solution for Frame two problems in calculating probability, based on the spinner shown here. by Maths experts to help you in doubts & scoring excellent marks in Class 9 exams.
Topper's Solved these Questions
- BOOK - FULL MARKSCHAPTER - PROBABILITYEXERCISE - EXERCISE 9.25videos
PROBABILITY
- BOOK - FULL MARKSCHAPTER - PROBABILITYEXERCISE - EXERCISE 9.3 (Multiple Choice Question)10videos
PROBABILITY
- BOOK - FULL MARKSCHAPTER - PROBABILITYEXERCISE - PROGRESS CHECK2videos
PROBABILITY
- BOOK - FULL MARKSCHAPTER - MENSURATION EXERCISE - Assignment (II. Answer the following questions)8videos
MENSURATION
- BOOK - FULL MARKSCHAPTER - REAL NUMBERSEXERCISE - Text Book Activity (Activity 3:)1videos
REAL NUMBERS
Similar Questions
A company manufactures 10000 Laptops in 6 months. Out of which 25 of them are found to be defective. When you choose one Laptop from the manufactured, what is the probability that selected Laptop is a good one .
02:11View SolutionA number between 0 and 1 that is used to measure uncertainty is called
01:31View SolutionA random experiment was conducted. Which of these cannot be considered as a probability of an outcome ?
(i) 15
(ii) −17
(iii) 0.40
(iv) -0.52
(v) 0
(vi) 1.3
(vii) 1
(viii) 72%
(ix) 107%02:45View SolutionFind the area of a quadrilateral ABCD where AB = 7 cm, DA = 15 cm, AC = 9 cm, BC = 6 cm and CD = 12 cm.
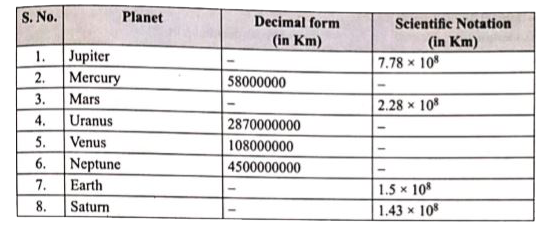
02:17View SolutionThe following list shows the mean distance of the plants of the solar system from the Sun. Complete the following table. Then arrange in order of magnitude starting with the distance of the planet closest to the Sun.
 05:41View Solution
Determine the point of symmetry of a regular hexagon.
02:21View SolutionDtermine the images of the following figure about the given line :
02:10View SolutionMatch the following Column A to Column B
 02:17View Solution
Match the following Column A to Column B
 02:10View Solution
Match the following Column A to Column B
 01:59View Solution
Calculate the volume of the given solid.
ltimg src="https://d10lpgp6xz60nq.cloudfront.net/physics_images/PS_MATH_VII_C06_E03_002_Q01.png" width="80%"gt01:19View SolutionThe inequation represented by the graph given below is :
01:32View SolutionThe inequation that best describes the graph given below is _________
04:05View SolutionThe inequation that best describes the following graph is _________
01:45View SolutionThe equation of straight line shown in figure is :
ltimg src="https://d10lpgp6xz60nq.cloudfront.net/physics_images/ALN_PHY_R04_E01_020_Q01.png" width="80%"gt01:44View SolutionWhat is the distance OA for the square shown in figure :- ltimg src="https://d10lpgp6xz60nq.cloudfront.net/physics_images/ALN_PHY_R05_E01_015_Q01.png" width="80%"gt
01:54View Solution

