From the data given below, draw a linear graph showing the relationship between the cost of trousers and the number of trousers.

Video Solution
|
Answer
Step by step video & image solution for From the data given below, draw a linear graph showing the relationship between the cost of trousers and the number of trousers. by Maths experts to help you in doubts & scoring excellent marks in Class 8 exams.
Updated on:21/07/2023Topper's Solved these Questions
- INTRODUCTION TO GRAPHS BOOK - MTG IIT JEE FOUNDATIONCHAPTER - INTRODUCTION TO GRAPHS EXERCISE - EXERCISE (SUBJECTIVE PROBLEMS) (VERY SHORT ANSWER TYPE)
1 Video
- INTRODUCTION TO GRAPHS BOOK - MTG IIT JEE FOUNDATIONCHAPTER - INTRODUCTION TO GRAPHS EXERCISE - EXERCISE (SUBJECTIVE PROBLEMS) (SHORT ANSWER TYPE)
2 Videos
- INTRODUCTION TO GRAPHS BOOK - MTG IIT JEE FOUNDATIONCHAPTER - INTRODUCTION TO GRAPHS EXERCISE - EXERCISE (Assertion & Reason Type)
8 Videos
- FOOTSTEPS TOWARDS JEE MAINBOOK - MTG IIT JEE FOUNDATIONCHAPTER - FOOTSTEPS TOWARDS JEE MAINEXERCISE - Section B (Numerical Value Type Questions)
9 Videos
- LINEAR EQUATIONS IN ONE VARIABLEBOOK - MTG IIT JEE FOUNDATIONCHAPTER - LINEAR EQUATIONS IN ONE VARIABLEEXERCISE - Olympiad/HOTS Corner
15 Videos
Similar Questions
Knowledge Check
Select the Venn diagram that best illustrates the relationship between the three given classes. Clothes, T-shirt, Trousers
A B
B C
C D
D
Which of the graphs shown below do not represent the relationship between incident light and the electron ejected from metal surface?
A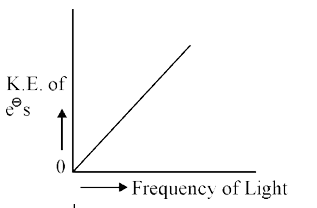 B
B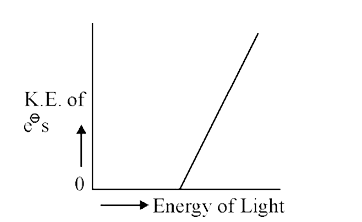 C
C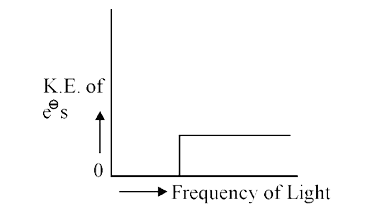 D
D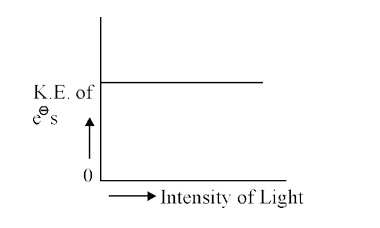
Which of the graphs shown below does not represent the relationship between incident light and the electron ejected from metal surface?
A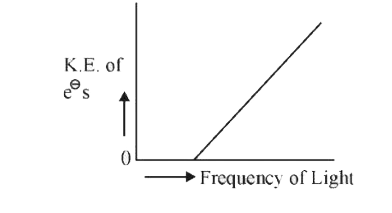 B
B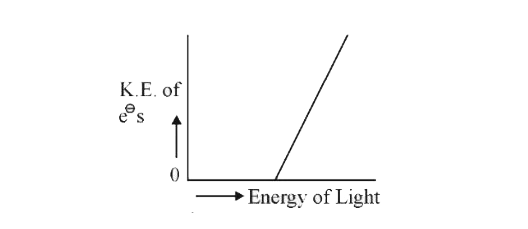 C
C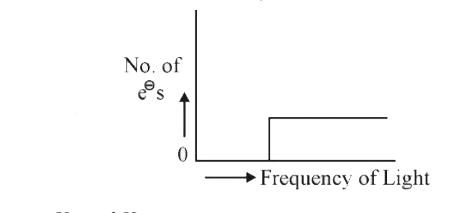 D
D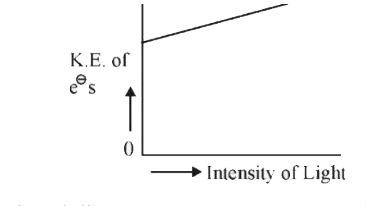
Draw a bar graph using the data given in the following table.

View SolutionDraw a graph showing the variation of decay rate with number of active nuclei.
View SolutionDraw a graph showing the variation of decay rate with number of active nuclei.
View SolutionUse the table given below to draw the graph.Use the graph drawn to find the value of a and b.
View SolutionDraw a pictograph to represent the data given below :

View Solution


