Draw a bar graph using the data given in the following table.

Step by step video & image solution for Draw a bar graph using the data given in the following table. by Maths experts to help you in doubts & scoring excellent marks in Class 6 exams.
Updated on:21/07/2023Topper's Solved these Questions
- DATA HANDLING BOOK - MTG IIT JEE FOUNDATIONCHAPTER - DATA HANDLING EXERCISE - NCERT Section (Exercise 9.1)
22 Videos
- DATA HANDLING BOOK - MTG IIT JEE FOUNDATIONCHAPTER - DATA HANDLING EXERCISE - NCERT Section (Exercise 9.2)
5 Videos
- DATA HANDLING BOOK - MTG IIT JEE FOUNDATIONCHAPTER - DATA HANDLING EXERCISE - Olympiad/HOTS Corner
10 Videos
- BASIC GEOMETRICAL IDEASBOOK - MTG IIT JEE FOUNDATIONCHAPTER - BASIC GEOMETRICAL IDEASEXERCISE - OLYMPIAD/HOTS CORNER
10 Videos
- DECIMALSBOOK - MTG IIT JEE FOUNDATIONCHAPTER - DECIMALSEXERCISE - OLYMPIAD/HOTS CORNER
20 Videos
Similar Questions
Find the mean of the data given in the following table :

View SolutionTake the data giving the minimum and the maximum temperature of various cities given in the table.
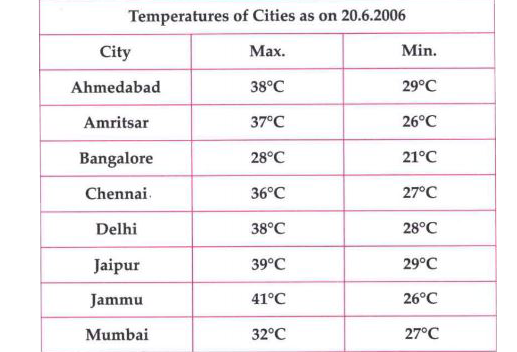
Name two cities where maximum temperature of one was less than the minimum temperature of the other
View SolutionTake the data giving the minimum and the maximum temperature of various cities given in the table.
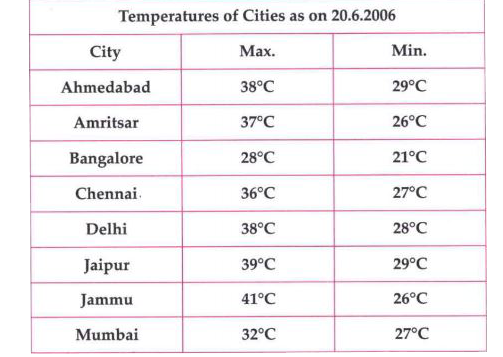
Name the city which has the least difference between its minimum and the maximum temperature
View SolutionTake the data giving the minimum and the maximum temperature of various cities given in the table.
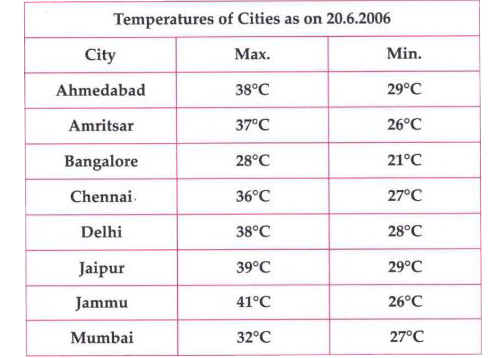
Which city has the largest difference in the minimum and maximum temperature on the given date ?
View SolutionTake the data giving the minimum and the maximum temperature of various cities given in the table.
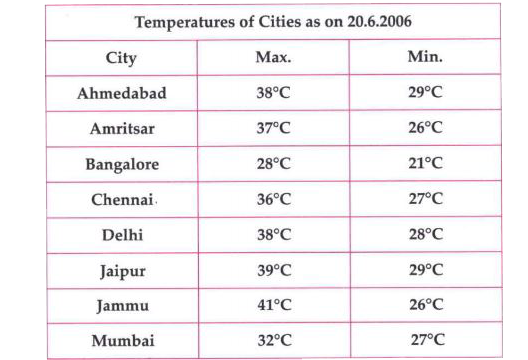
Which is the hottest city and which is the coldest city ?
View SolutionPrepare a bar graph of the data given in question 28.
View SolutionDraw a line graph to represent the runs made by different batsmen in a match whose details are given in the following table:

View SolutionThe lengths of 62 levels of a plant are measured in millimetres and the data is represented in the following table
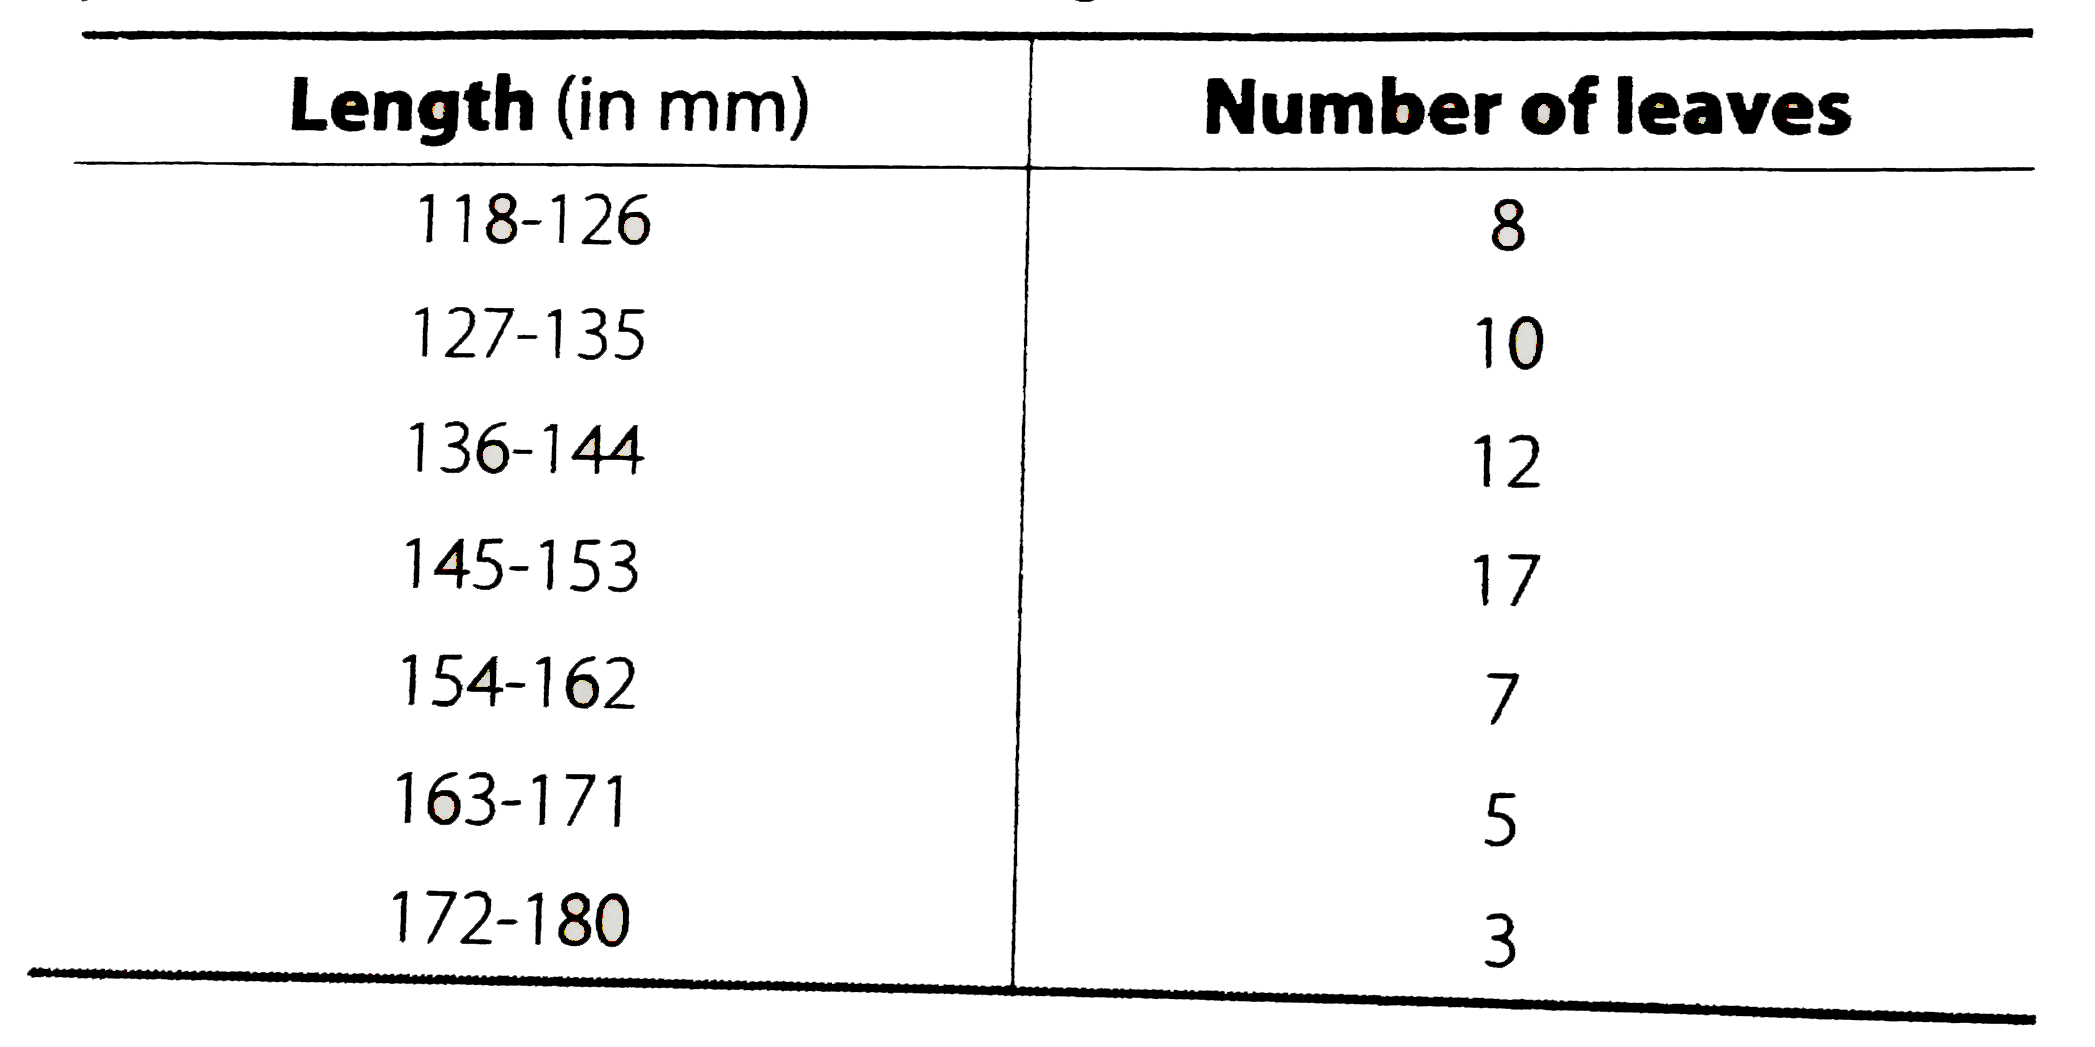
Draw a histrogram to represent the data above.
View SolutionDraw the line graph for the following table:

View SolutionComplete the following crossword puzzle (Figure) by using the name of the chemical elements. Use the data given in the table following.

View Solution
