From the following frequency table.

Find : (a) The frequency of fifth class interval
(b) The upper class limit of third class interval.
(c) The lower class limit of second class interval.
(d) The class mark of sixth class interval.
The correct Answer is:(a) 35 (b) 15 (c) 5 (d) 27.5
Step by step video & image solution for From the following frequency table. Find : (a) The frequency of fifth class interval (b) The upper class limit of third class interval. (c) The lower class limit of second class interval. (d) The class mark of sixth class interval. by Maths experts to help you in doubts & scoring excellent marks in Class 9 exams.
Updated on:21/07/2023Topper's Solved these Questions
- STATISTICSBOOK - NAGEEN PRAKASHAN ENGLISHCHAPTER - STATISTICSEXERCISE - EXERCISE 14B
13 Videos
- STATISTICSBOOK - NAGEEN PRAKASHAN ENGLISHCHAPTER - STATISTICSEXERCISE - Exercise 14c
20 Videos
- STATISTICSBOOK - NAGEEN PRAKASHAN ENGLISHCHAPTER - STATISTICSEXERCISE - Problems From NCERT/exemplar
22 Videos
- QUADRILATERALSBOOK - NAGEEN PRAKASHAN ENGLISHCHAPTER - QUADRILATERALSEXERCISE - Revision Exercise (long Answer Questions)
5 Videos
- SURFACE AREA AND VOLUMEBOOK - NAGEEN PRAKASHAN ENGLISHCHAPTER - SURFACE AREA AND VOLUMEEXERCISE - Revision Exercise (long Answer Questions)
10 Videos
Similar Questions
Knowledge Check
If the upper and the lower limits of a class interval are 16 and 10, the class-interval is ...
A18−12B10−16C16−10D17−11
A frequency polygon is constructed by plotting frequency of the class interval and the (a) upper limit of the class (b) lower limit of the class (c) mid value of the class (d) any values of the class
View SolutionFor the following frequency distribution

The upper limit of median class is
View SolutionThe mark of the class 90−120 is
View SolutionConsider the data

The frequency of the upper limit of the median class and the lower limit of the modal class is
View SolutionIn a frequency distribution, the mid-value of a class is 15 and the class intervals is 4. The lower limit of the class is 10 (b) 12 (c) 13 (d) 14
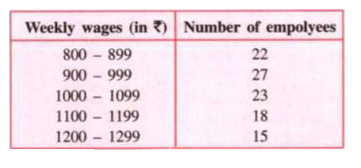
View SolutionThe table , given below , shows the frequency distributions of the weekly wages of the employee of a company:

Find :
(i) the lower limit of the fourth class.
(ii) the upper limit of the fifth class.
(iii) the class boundaries of the second class.
(iv) the class mark of the first class.
(v) the class size of the third class.
(vi) cumulative frequency of the fourth class.
View SolutionWrite the comulative frequency of class interval 30-40

View Solution

