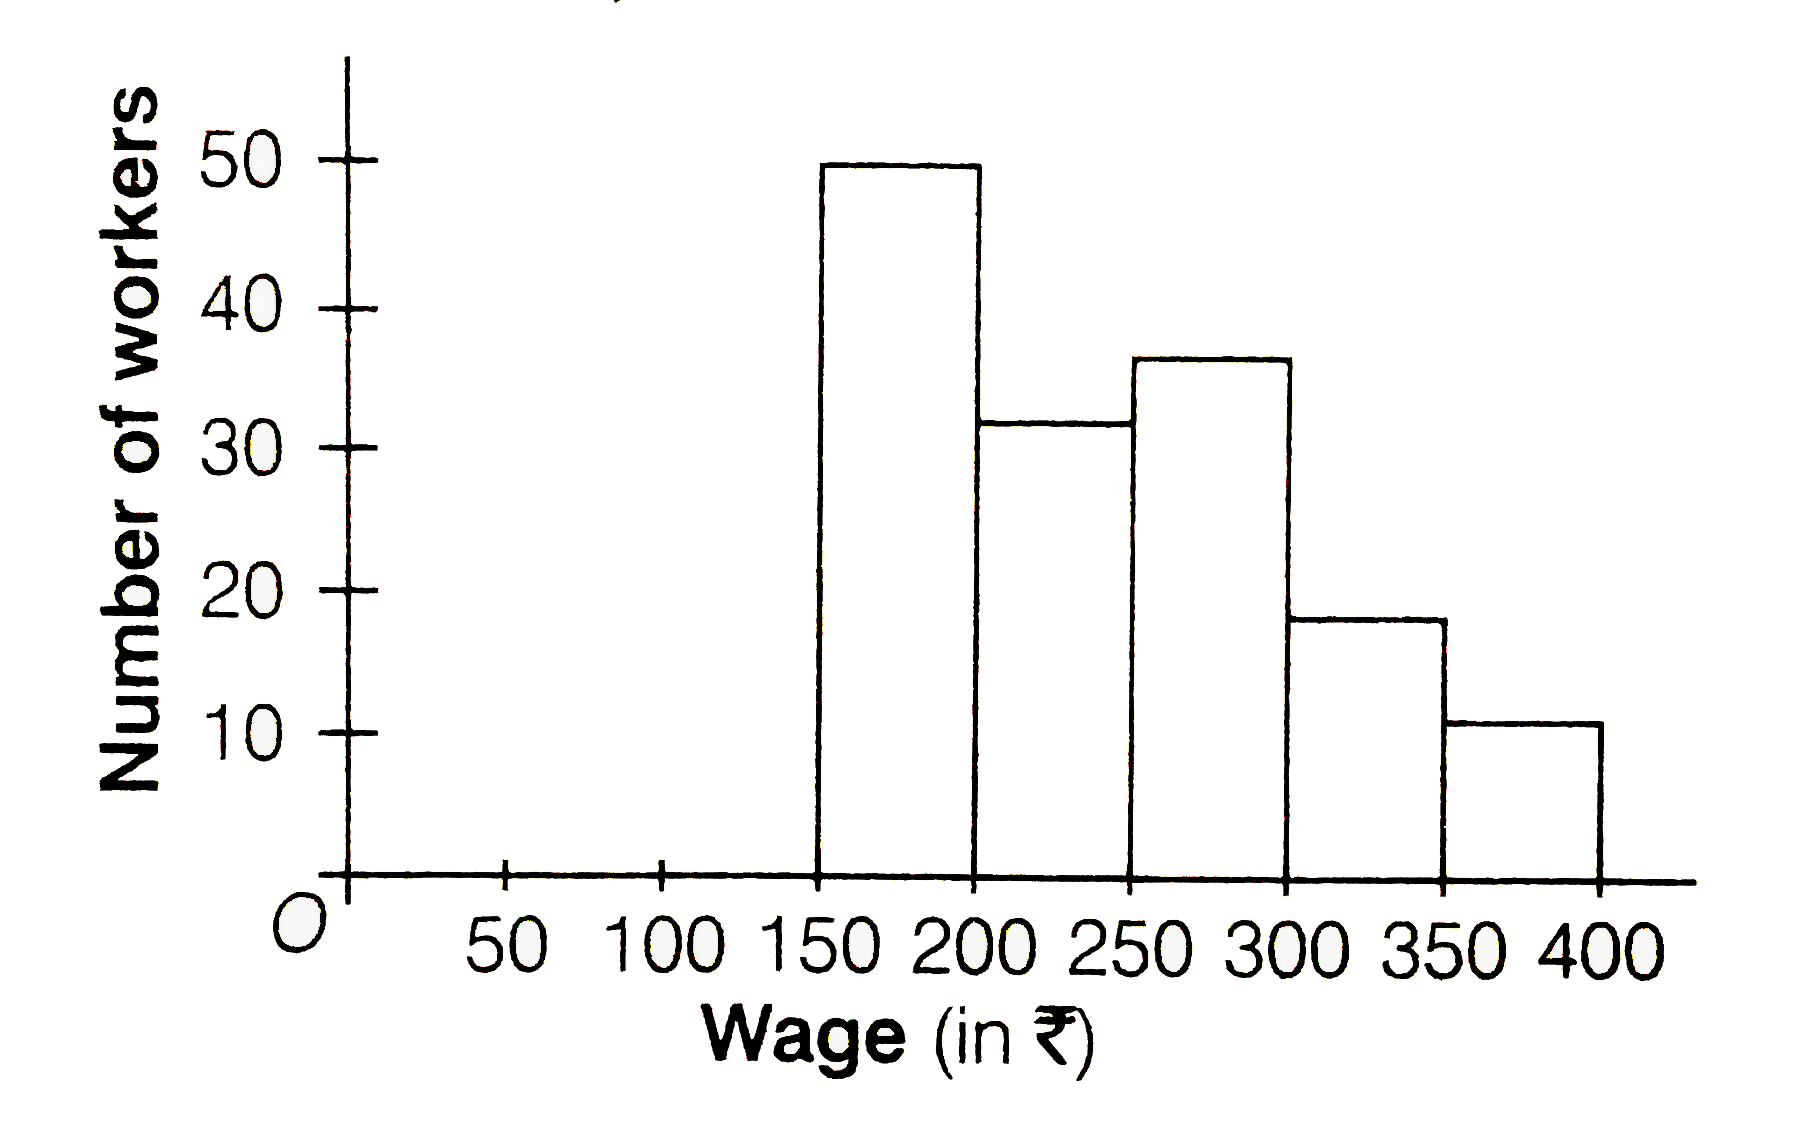
Given below is distribution of daily earnings of 60 workers in a factory

Find 45th percentile.
The correct Answer is:P45=165
Step by step video & image solution for Given below is distribution of daily earnings of 60 workers in a factory Find 45^(th) percentile. by Maths experts to help you in doubts & scoring excellent marks in Class 11 exams.
Updated on:21/07/2023Topper's Solved these Questions
Similar Questions
Consider the following distribution of daily wages of 50 workers of a factory.Find the mean daily wages of the workers of the factor}- by using an appropriate method.
View SolutionConsider the following distribution of daily wages of 50 workers of a factory. Daily wages (in Rs).: 100-120 120-140 140-160 160-180 180-200 Numberof workers: 12 14 8 6 10 Findthe mean daily wages of the workers of the factory by using an appropriate method.
View SolutionGiven below is the frequency distribution of wages (in Rs.) of 30 workers in a certain factory:
Wages (In Rs.)110−130130−150150−170170−190190−210210−230230−250 No. of workers3456543 A worker is selected at random. Find the probability that his wages are:
(i)less than Rs. 150 (ii) at least Rs. 210 (iii)more than or equal to 150 but less than Rs. 210
View SolutionGiven below is the frequency distribution of the heights of playces in a school :

Find the modal height
View SolutionGiven below is the frequency distribution of wages: A worker is selected at random. Find the probability that his wages are: (i) less than Rs. 150 (ii) at least Rs. 210 (iii) more than or equal to 150 but less than Rs. 210.
View Solutionfind the mean salary of 60 workers of a factory from the given table
View SolutionThe following distribution gives the daily income of 50 workers of a factory: Daily income (in Rs): 100-120 120-140 140-160 160-180 180-200 Number of workers: 12 14 8 6 10 Convert the above distribution to a less than type cumulative frequency distribution and draw its ogive.
View SolutionThe following distribution gives the number of accidents met by 160 workers in a factory during a month. No. of accidents (x) : 0 1 2 3 4 No. of workers (f) : 70 52 34 3 1 Find the average number of accidents per worker.
View SolutionThe following table given the daily income of 50 workers of a factory :

Find the mean of above data.
View SolutionIn the figure, there is histrogram depicting daily wages of workers in a factory. Construct the frequency distribution table.

View Solution
