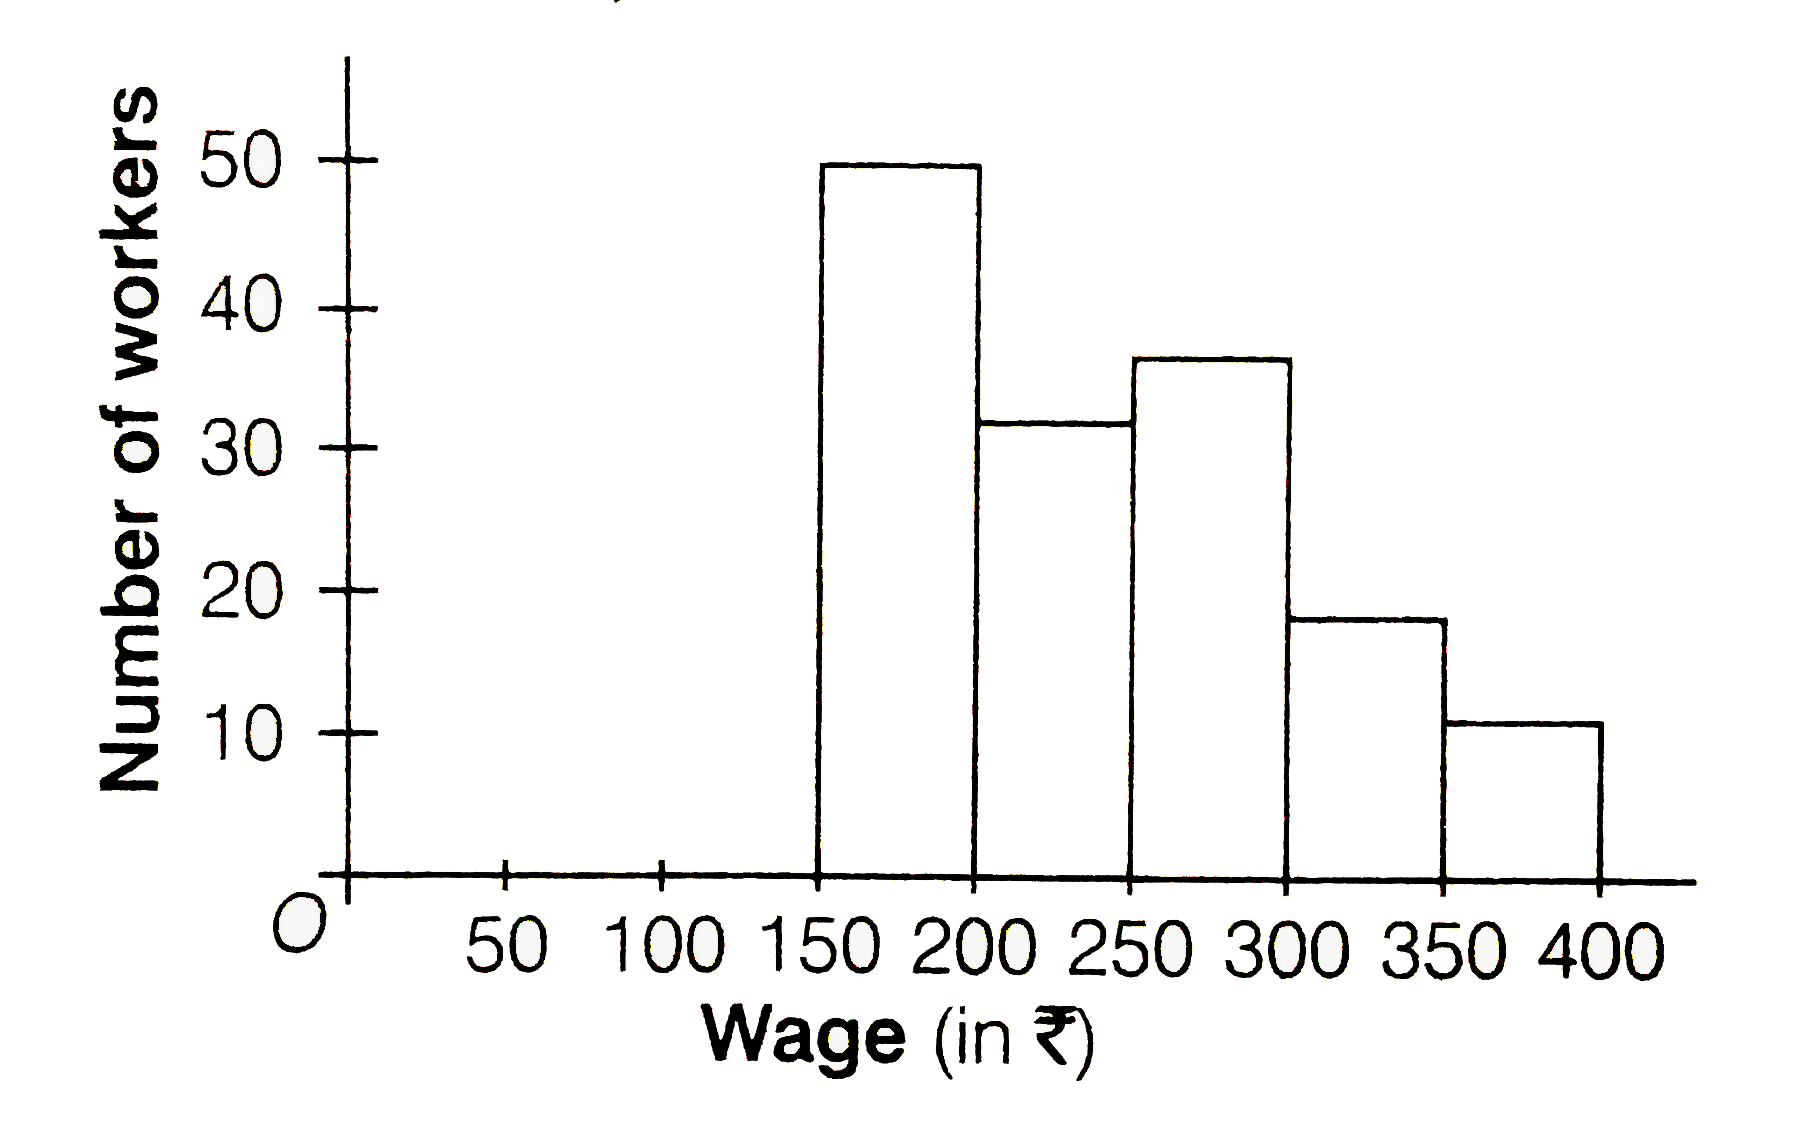
Consider the following distribution of daily wages of 50 workers of a factory.Find the mean daily wages of the workers of the factor}- by using an appropriate method.
To find the mean daily wages of the workers in the factory, we will follow these steps:
Step 1: Create a Frequency Distribution Table
We will create a table with the given daily wage ranges and their corresponding frequencies.
| Daily Wage Range | Frequency (f_i) |
|-------------------|-----------------|
| 500 - 520 | 12 |
| 520 - 540 | 14 |
| 540 - 560 | 8 |
| 560 - 580 | 6 |
| 580 - 600 | 10 |
Step 2: Calculate the Midpoint (x_i) for Each Wage Range
The midpoint for each wage range can be calculated using the formula:
xi=Lower Limit+Upper Limit2
Calculating midpoints:
- For 500 - 520: x1=500+5202=510
- For 520 - 540: x2=520+5402=530
- For 540 - 560: x3=540+5602=550
- For 560 - 580: x4=560+5802=570
- For 580 - 600: x5=580+6002=590
Step 3: Create a New Table with Midpoints and Calculate f_i * x_i
Now we will create a new table that includes the midpoints and the product of frequency and midpoint.
| Daily Wage Range | Frequency (f_i) | Midpoint (x_i) | f_i * x_i |
|-------------------|-----------------|-----------------|-----------|
| 500 - 520 | 12 | 510 | 6120 |
| 520 - 540 | 14 | 530 | 7420 |
| 540 - 560 | 8 | 550 | 4400 |
| 560 - 580 | 6 | 570 | 3420 |
| 580 - 600 | 10 | 590 | 5900 |
Step 4: Calculate the Summation of f_i and f_i * x_i
Now we will calculate the total of the frequencies and the total of the products fi∗xi.
- Total Σfi=12+14+8+6+10=50
- Total Σ(fi∗xi)=6120+7420+4400+3420+5900=27260
Step 5: Calculate the Mean
The mean can be calculated using the formula:
Mean=Σ(fi∗xi)Σfi
Substituting the values:
Mean=2726050=545.2
Conclusion
The mean daily wages of the workers in the factory is 545.2.
---
We will create a table with the given daily wage ranges and their corresponding frequencies.
|-------------------|-----------------|
| 500 - 520 | 12 |
| 520 - 540 | 14 |
| 540 - 560 | 8 |
| 560 - 580 | 6 |
| 580 - 600 | 10 |
The midpoint for each wage range can be calculated using the formula:
xi=Lower Limit+Upper Limit2
- For 500 - 520: x1=500+5202=510
- For 520 - 540: x2=520+5402=530
- For 540 - 560: x3=540+5602=550
- For 560 - 580: x4=560+5802=570
- For 580 - 600: x5=580+6002=590
Now we will create a new table that includes the midpoints and the product of frequency and midpoint.
|-------------------|-----------------|-----------------|-----------|
| 500 - 520 | 12 | 510 | 6120 |
| 520 - 540 | 14 | 530 | 7420 |
| 540 - 560 | 8 | 550 | 4400 |
| 560 - 580 | 6 | 570 | 3420 |
| 580 - 600 | 10 | 590 | 5900 |
Now we will calculate the total of the frequencies and the total of the products fi∗xi.
- Total Σ(fi∗xi)=6120+7420+4400+3420+5900=27260
The mean can be calculated using the formula:
Mean=Σ(fi∗xi)Σfi
Mean=2726050=545.2
The mean daily wages of the workers in the factory is 545.2.
Topper's Solved these Questions
- STATISTICSBOOK - NCERT ENGLISHCHAPTER - STATISTICSEXERCISE - EXERCISE 14.2
6 Videos
- SOME APPLICATIONS OF TRIGONOMETRYBOOK - NCERT ENGLISHCHAPTER - SOME APPLICATIONS OF TRIGONOMETRYEXERCISE - SOLVED EXAMPLES
7 Videos
- SURFACE AREAS AND VOLUMESBOOK - NCERT ENGLISHCHAPTER - SURFACE AREAS AND VOLUMESEXERCISE - Exercise 13.3
9 Videos
Similar Questions
The following table gives the weekly wage of workers in a factory:

Find the mean
View SolutionThe following table given the daily income of 50 workers of a factory :

Find the mean of above data.
View SolutionGiven below is distribution of daily earnings of 60 workers in a factory

Find 45th percentile.
View SolutionConsider the following distribution of daily wages of 50 workers of a factory. Daily wages (in Rs).: 100-120 120-140 140-160 160-180 180-200 Numberof workers: 12 14 8 6 10 Findthe mean daily wages of the workers of the factory by using an appropriate method.
View SolutionFind the mean salary of 60 workers of a factory from the following table
View Solutionfind the mean salary of 60 workers of a factory from the given table
View SolutionFind mean of the following distribution using short cut method:

View SolutionFind the mean for the following distribution table by short cut method:

View SolutionThe following histogram shows the monthly wages (in Rs.) of workers in a factory: Figure Find the largest and least number of workers and also their wages in rupees.
View SolutionIn the figure, there is histrogram depicting daily wages of workers in a factory. Construct the frequency distribution table.

View Solution
