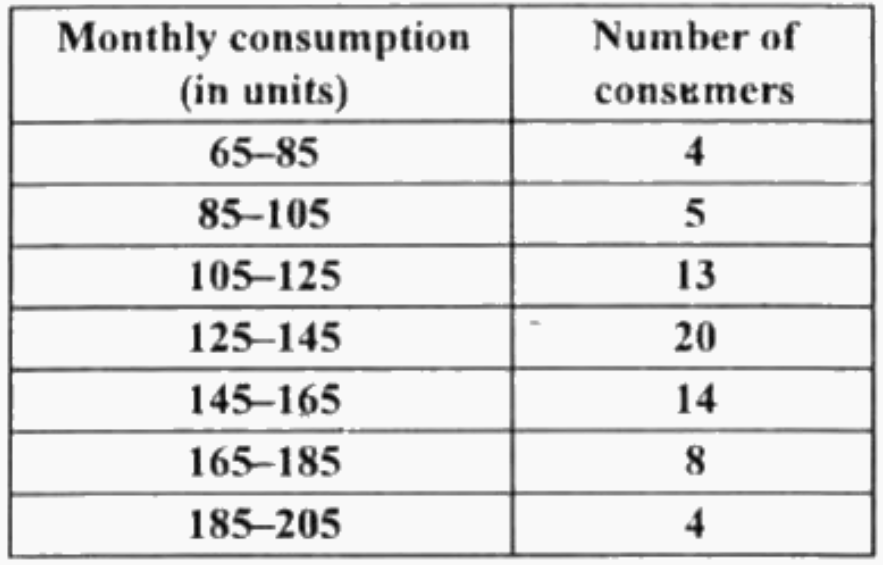
Given below is the number of units of electricty consumed is a week in a certain locality

Calculate the median
Step by step video & image solution for Given below is the number of units of electricty consumed is a week in a certain locality Calculate the median by Maths experts to help you in doubts & scoring excellent marks in Class 10 exams.
Updated on:21/07/2023Topper's Solved these Questions
- MEAN,MEDAN,MODE OF GROUPED,DATA CUMULATIVE FREQUENCY GRAPH AND OGIVE BOOK - RS AGGARWALCHAPTER - MEAN,MEDAN,MODE OF GROUPED,DATA CUMULATIVE FREQUENCY GRAPH AND OGIVE EXERCISE - EXERCISE 18 C
10 Videos
- MEAN,MEDAN,MODE OF GROUPED,DATA CUMULATIVE FREQUENCY GRAPH AND OGIVE BOOK - RS AGGARWALCHAPTER - MEAN,MEDAN,MODE OF GROUPED,DATA CUMULATIVE FREQUENCY GRAPH AND OGIVE EXERCISE - EXERCISE 18 D
3 Videos
- MEAN,MEDAN,MODE OF GROUPED,DATA CUMULATIVE FREQUENCY GRAPH AND OGIVE BOOK - RS AGGARWALCHAPTER - MEAN,MEDAN,MODE OF GROUPED,DATA CUMULATIVE FREQUENCY GRAPH AND OGIVE EXERCISE - EXERCISE 18 A
25 Videos
- LINEAR EQUATIONS IN TWO VARIABLES BOOK - RS AGGARWALCHAPTER - LINEAR EQUATIONS IN TWO VARIABLES EXERCISE - QUESTION
2 Videos
- PERIMETER AND AREA OF PLANE FIGURES BOOK - RS AGGARWALCHAPTER - PERIMETER AND AREA OF PLANE FIGURES EXERCISE - TEST YOURSELF (SHORT -ANSWER QUESTIONS)
1 Videos
Similar Questions
the distribution given below shows the number of wickets taken by bowlers in one-day cricket matches. find the mean and the median of the number of wickets taken
View SolutionThe distribution given below shows the number of wickets taken by bowlers in one-day cricket matches . Find the mean and the median of the number of wickets taken

View Solution
Knowledge Check
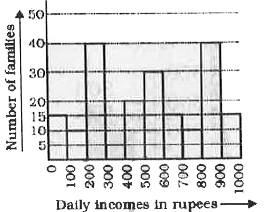
The histogram, given below, shows the number of families of a locality having various daily incomes, as obtained by a survey. Observe the graph and answer the questions based on it.

The number of families, whose daily incomes are below Rs 200, isA25B20C15D10Given below in the information about solar plants installed in four
differnet colonies W,X, Y, Z . Number of solar plants in colonies W,
X, Y, Z are 24, 20, 15 and 12 respectively. Number of electricity
units produced in one week by one solar plant when they operate
with maximum efficiency in colonies W, X,Y,Z are 2 lakh units /
week , 80000 units/week , 1 Lakh units/week and 1.5 Lakh units/
week respectively. Number of houses in each colony W,X,Y,Z
are 540 , 240 , 150 and 350 respectively . total units produced are
consumed equally by each house in the colony. → Different number of solar plants are operated in four different weeks
In first week number of solar plants are operative in colonies W, X,Y, Z are 75%, 50%,40% and 75% respectively . In second week
it is 50% , 76%, 60% and 50% respectively. In third week it is 75%,
100% , 80% and 50% respectively. In fourth week it is 100%, 50%,
60% and 75% respectively.
→ Given below is the three ranges of efficiency of a solar plants
(numer of unit produced /week by one plant)
Efficiency TypeRangeEfficiency160%−70%Efficiency245%−55%Efficiency330%−40%
→ level 1 : Consider upper limit of range of efficiency
→ level 2 : Consider mid of range of efficiency
→ level 3 : Consider the lower range of efficiency
Eg If a solar plants is operative at efficiency 2 than its level 2
efficiency will ve =45+552=50%
Its level 1 efficiency will be 55%
lts level 3 efficiency will ve 45%
What is the ratio of units consumed par house in colony X
in week 4 operating at level 3 of Efficiency range 3 to the level 3
efficiency range 2 of the colony z ?A20:27B13:19C15:19D10:33In a pot, there is a mixture of milk and water in the ratio 4 : 5. If it is filled with an additional 8 litres of milk, the pot would be full and ratio of milk and water would become 6 : 5. Find the capacity of the pot ?
Aa. 44 litBb. 33 litCc. 22 litDd. 11 lit
The following frequency distribution gives the monthly consumption of electricity of 68 consumers of a locality. Find the median, mean and mode of the data and compare them.

View SolutionCalculate the number of units consumed by a TV in a leap year which is rated at 100 W if it is used 6 hours per day.
View SolutionThe marks obtained by 60 students in a certain subject out of 75 are given below :

What is the median ?
View SolutionCalculate the units of energy consumed by 100W electric bulb in 5 hours,
View SolutionGiven below in the information about solar plants installed in four
differnet colonies W,X, Y, Z . Number of solar plants in colonies W,
X, Y, Z are 24, 20, 15 and 12 respectively. Number of electricity
units produced in one week by one solar plant when they operate
with maximum efficiency in colonies W, X,Y,Z are 2 lakh units /
week , 80000 units/week , 1 Lakh units/week and 1.5 Lakh units/
week respectively. Number of houses in each colony W,X,Y,Z
are 540 , 240 , 150 and 350 respectively . total units produced are
consumed equally by each house in the colony. → Different number of solar plants are operated in four different weeks
In first week number of solar plants are operative in colonies W, X,Y, Z are 76%, 50%,40% and 75% respectively . In second week
it is 50% , 76%, 60% and 50% respectively. In third week it is 75%,
100% , 80% and 50% respectively. In fourth week it is 100%, 50%
60% and 75% respectively.
→ Given below is the three ranges of efficiency of a solar plants
(numer of unit produced /week by one plant)
Efficiency TypeRangeEfficiency160%−70%Efficiency245%−55%Efficiency330%−40%
→ level 1 : Consider upper limit of range of efficiency
→ level 2 : Consider mid of range of efficiency
→ level 3 : Consider the lower range of efficiency
Eg If a solar plants is operative at efficiency 2 than its level 2
efficiency will ve =45+552=50%
Its level 1 efficiency will be 55%
lts level 3 efficiency will ve 45%
What is the ratio of total production of colony W in first week
at level 1 of efficiency 2 to the total production of colony X
in second week at Leval 2 of efficiency 1 .
View Solution
