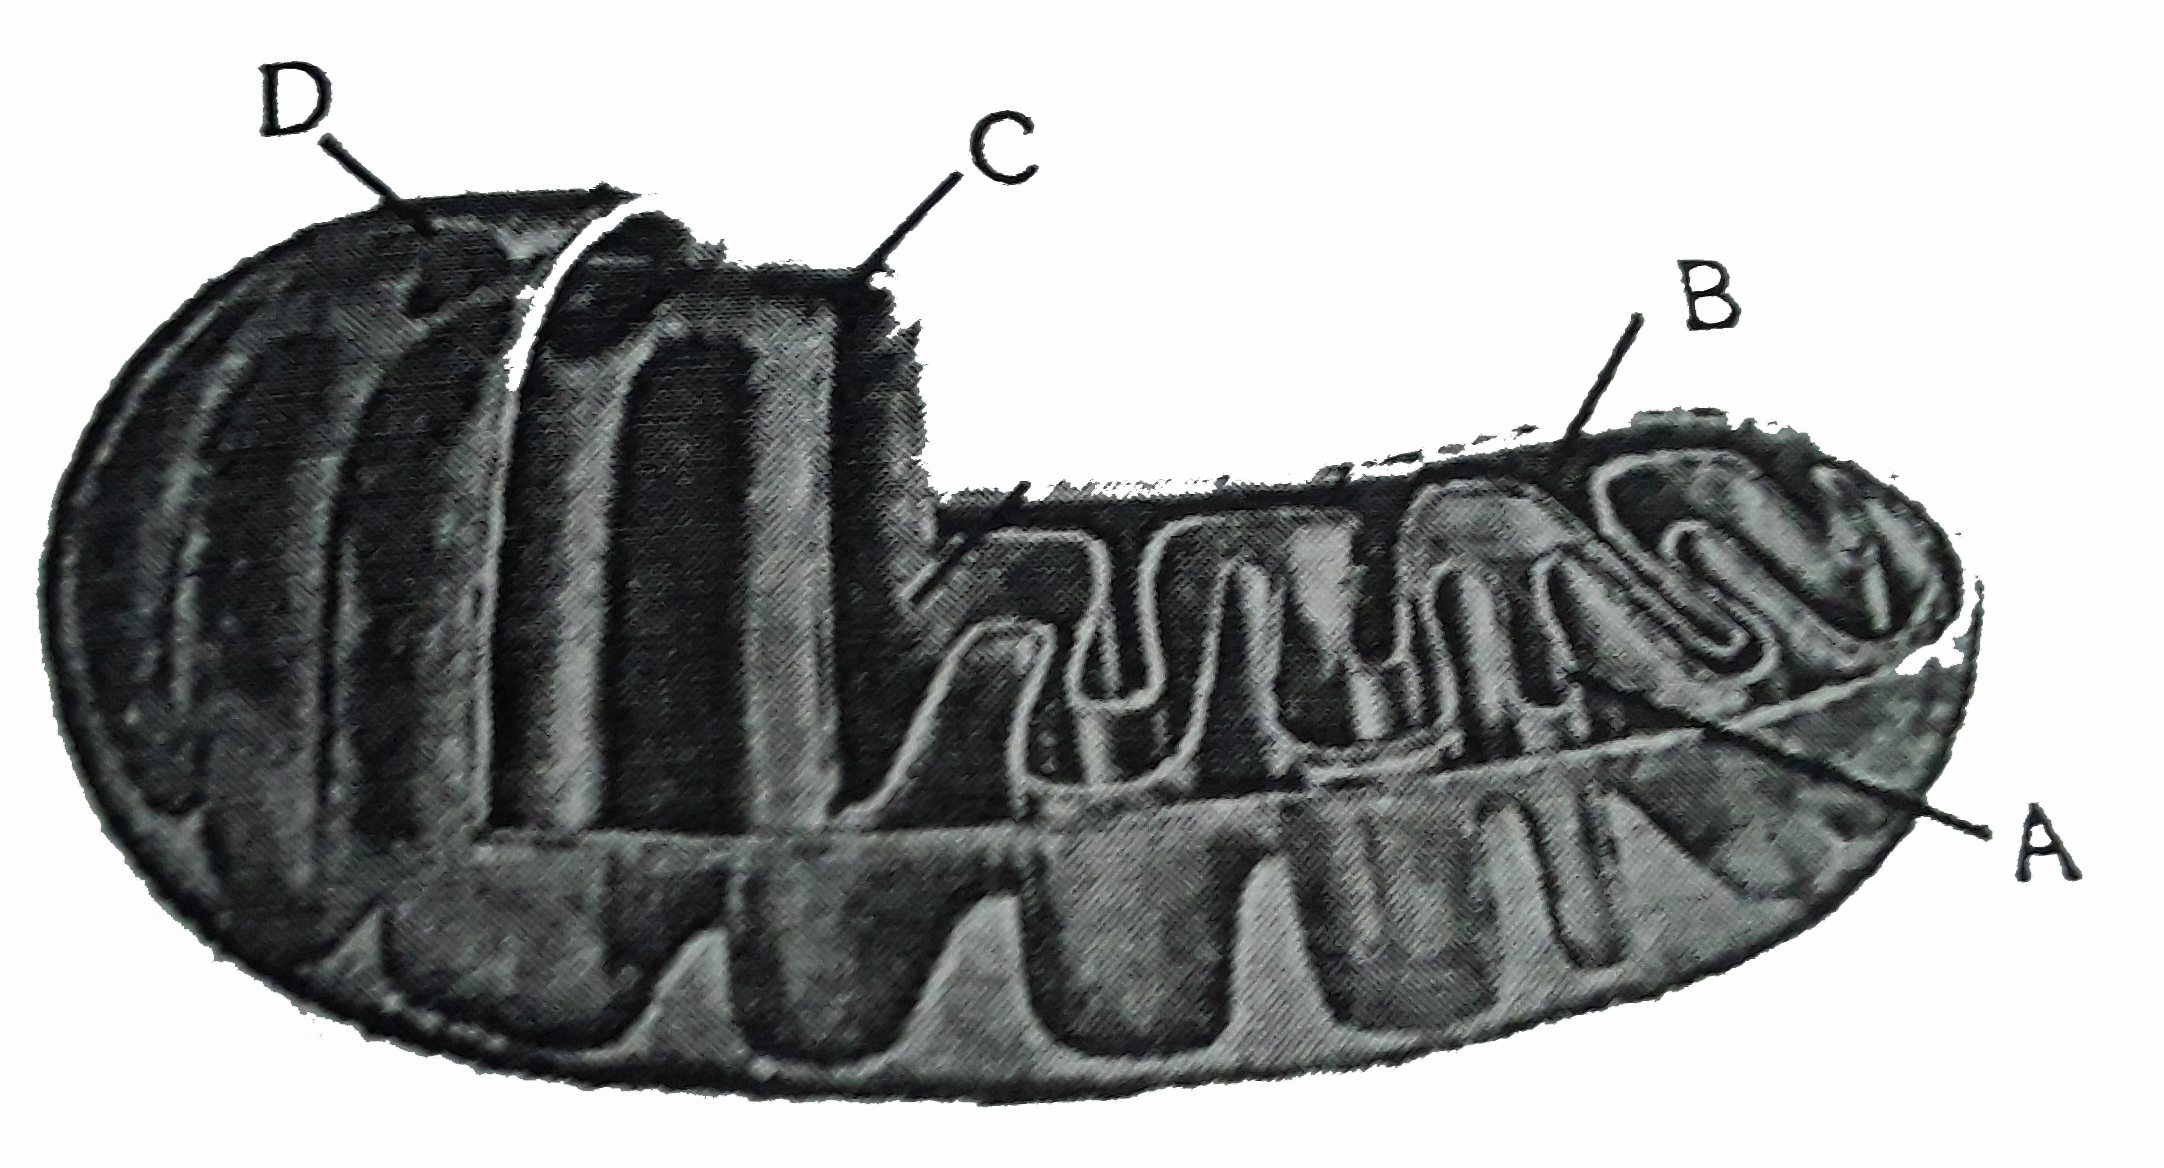
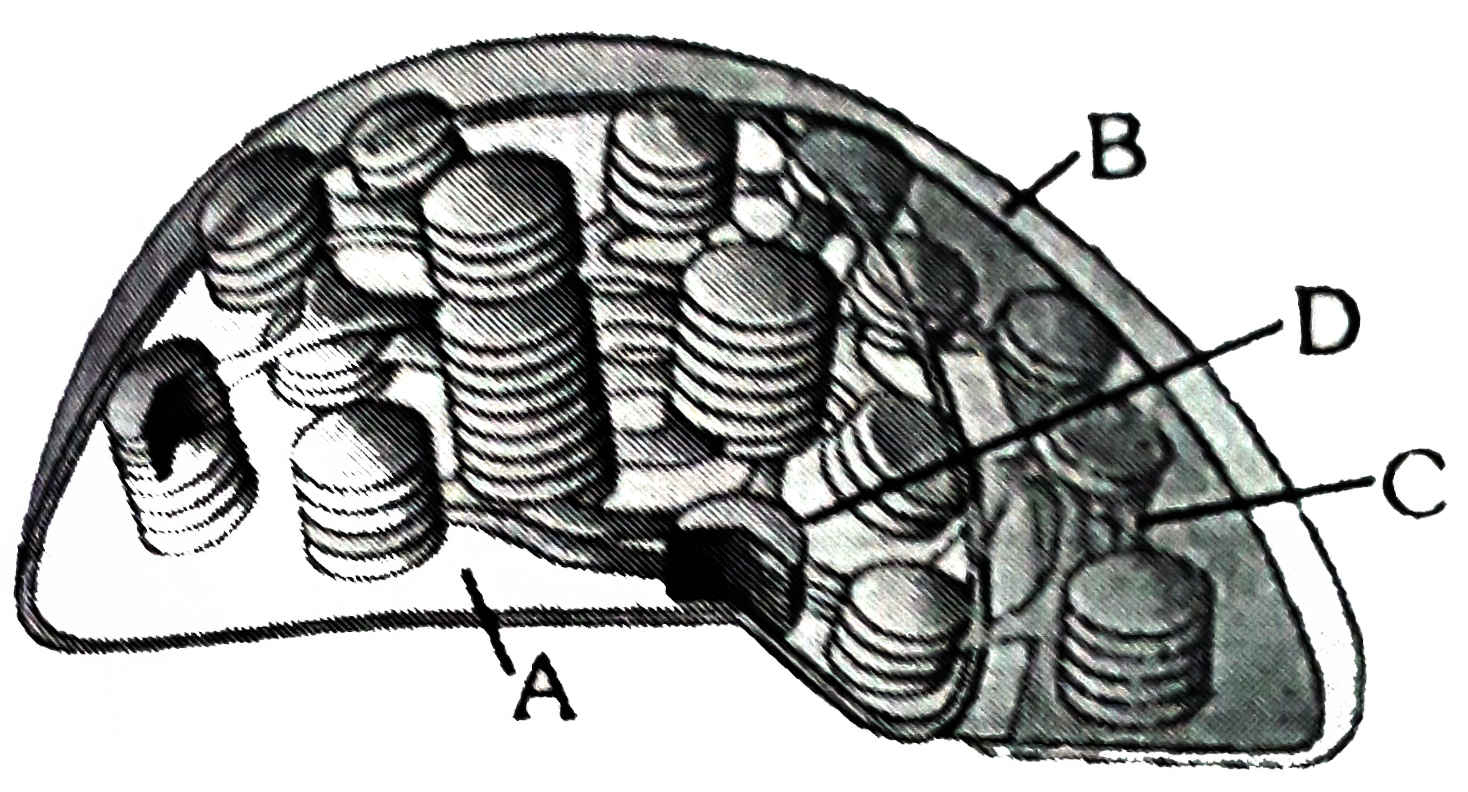
Given, figure showing the percentage of people staying in given four Villages A, B, C and D. Then, that is called
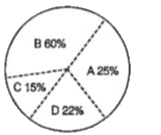
pie chart
line chart
bar chart
None of these
The correct Answer is:A
Step by step video, text & image solution for Given, figure showing the percentage of people staying in given four Villages A, B, C and D. Then, that is called by Maths experts to help you in doubts & scoring excellent marks in Class 12 exams.
Updated on:21/07/2023Topper's Solved these Questions
Similar Questions
Knowledge Check
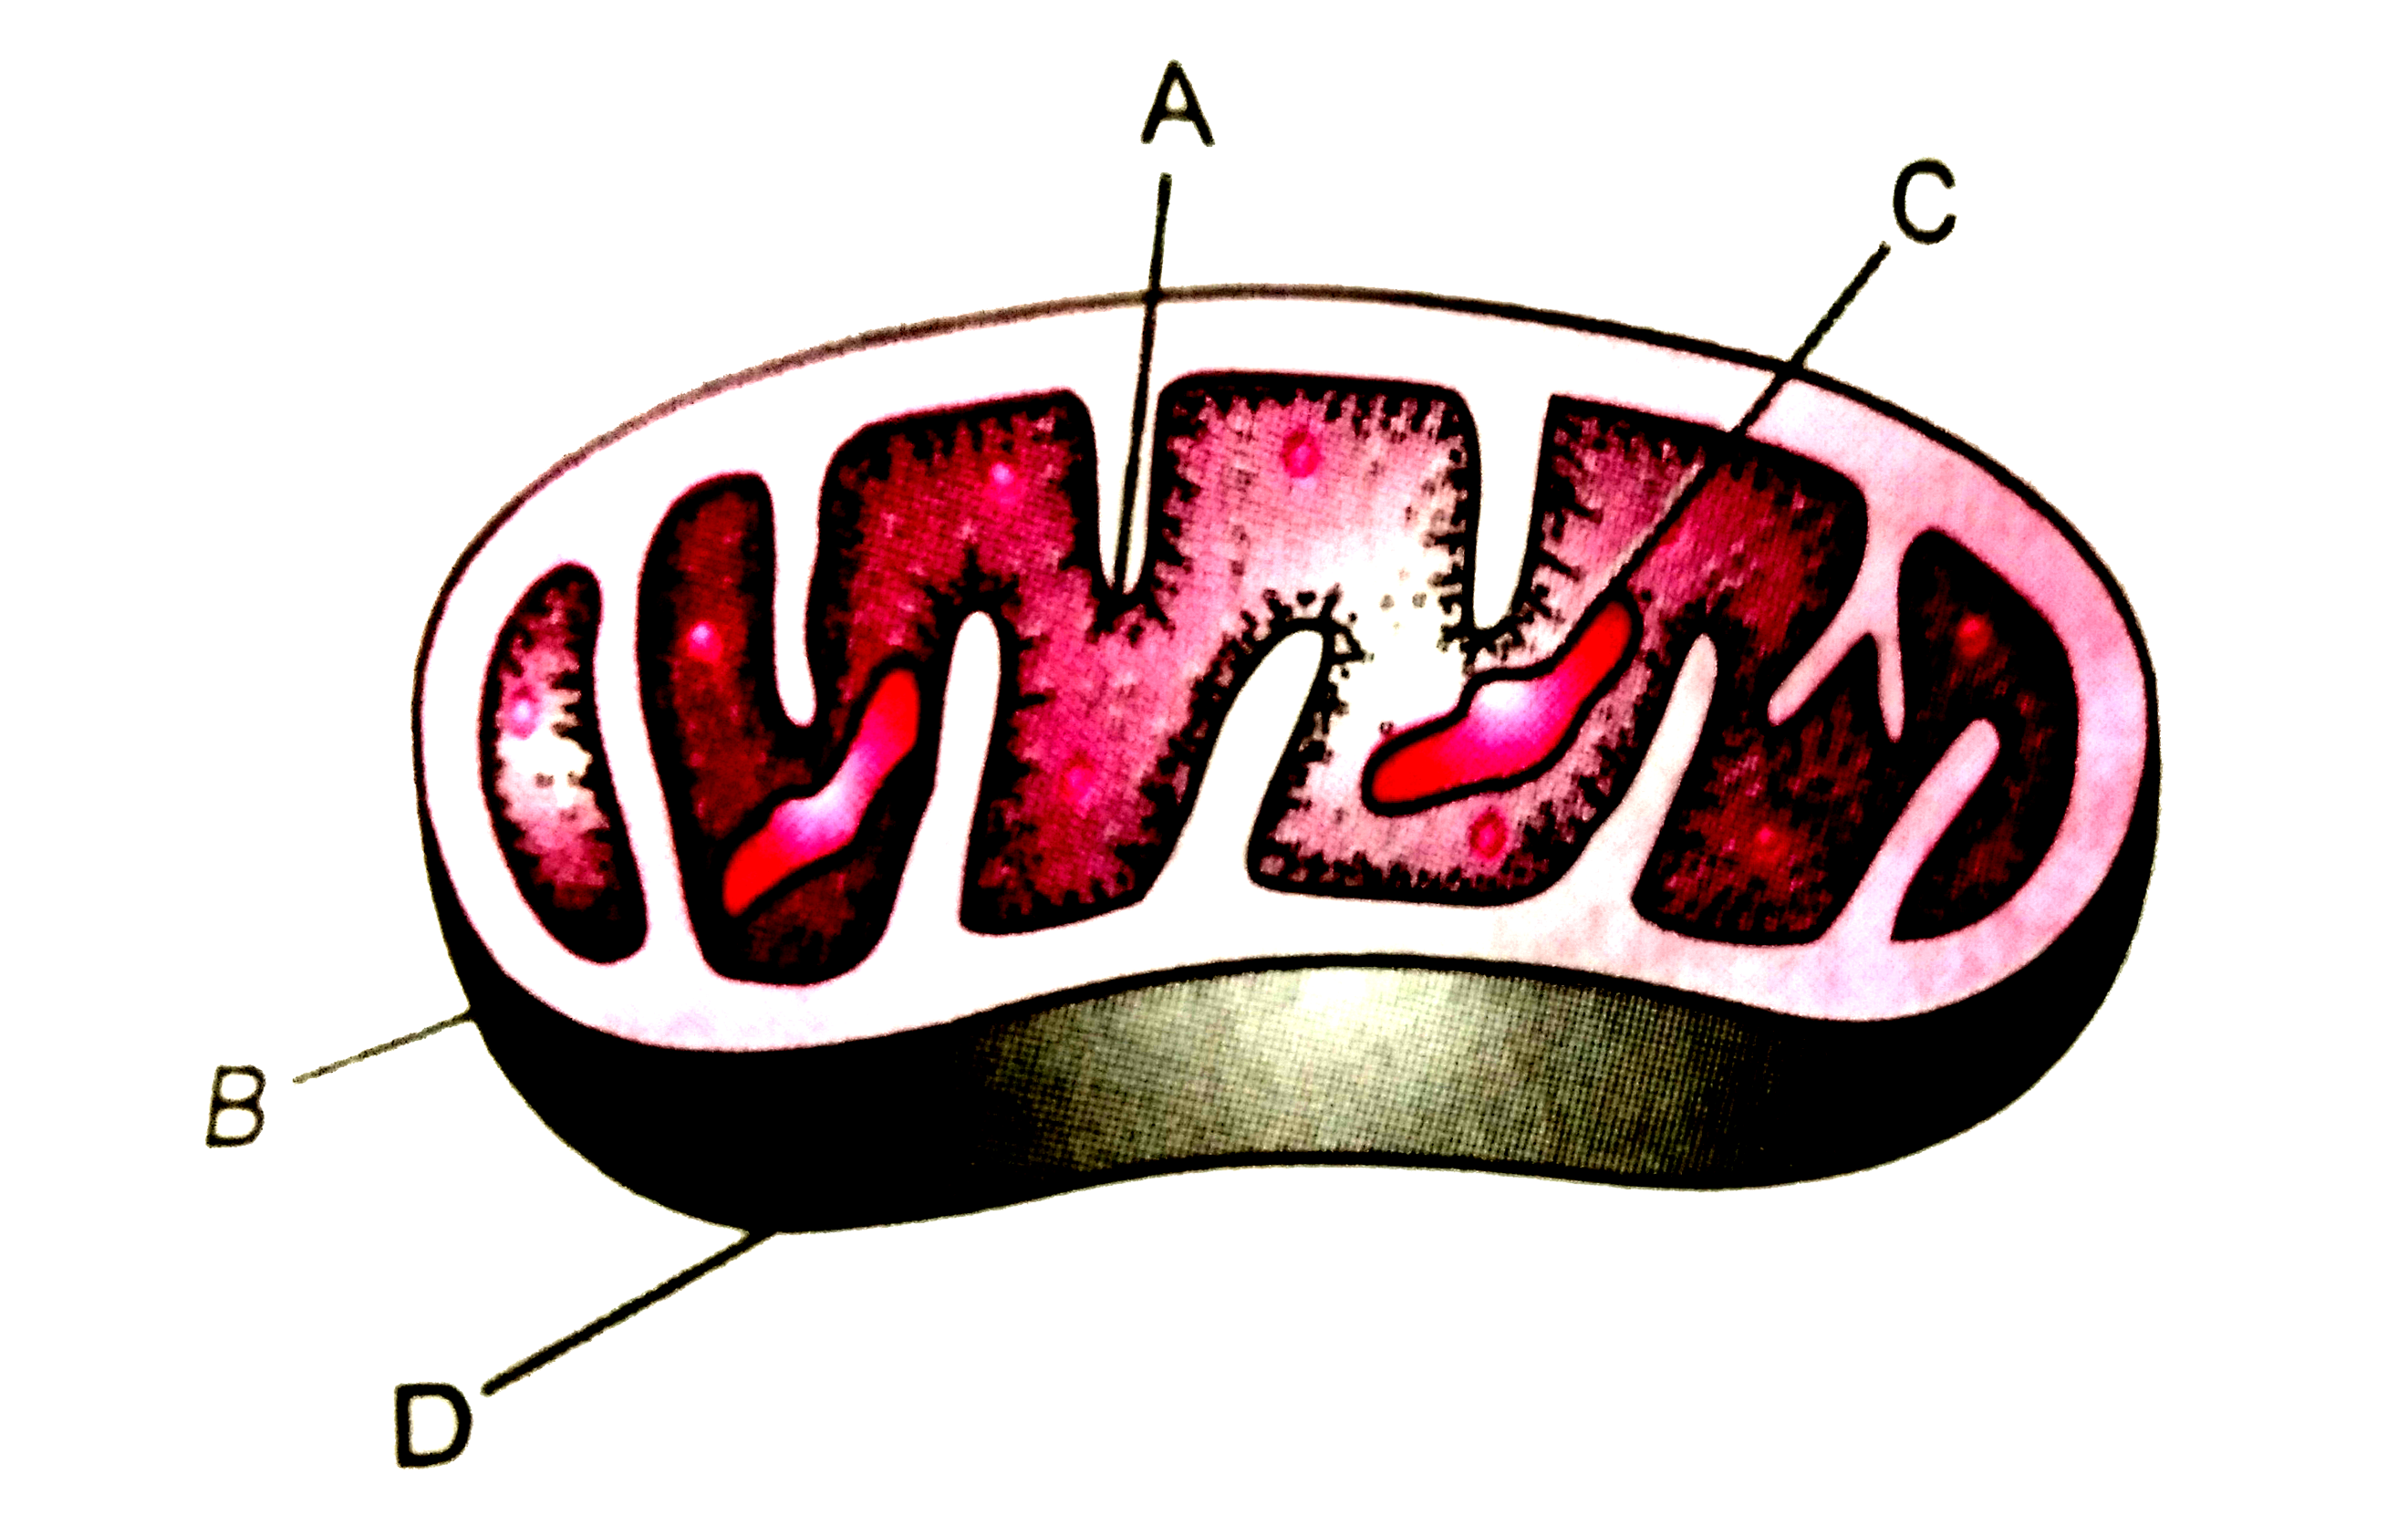
The given figure shows the structures of a mitochondrin with its four parts labelled A, B, C and D. Select the part correcltly matched with its function
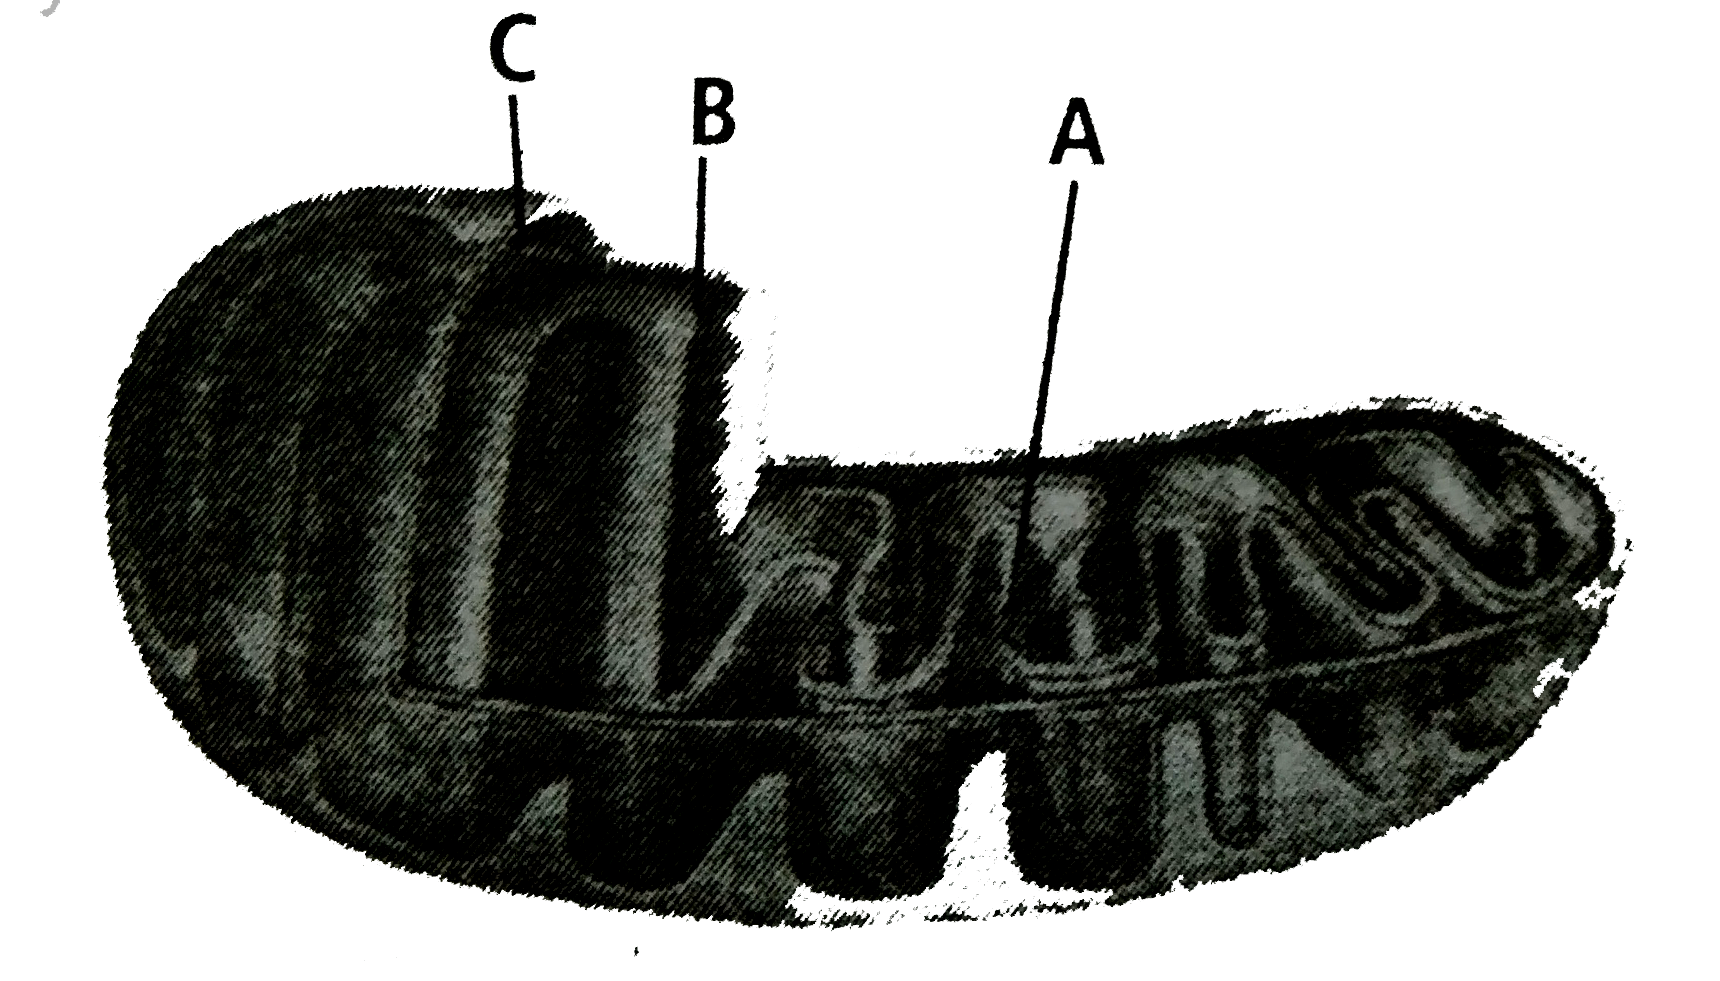 AC - Gives rise to inner membrane by splittingBB - Forms infoldings called cristaeCA - Possesses single circular DNA molecule and ribosomesDnone of these
Identify A, B, C and D in given figure
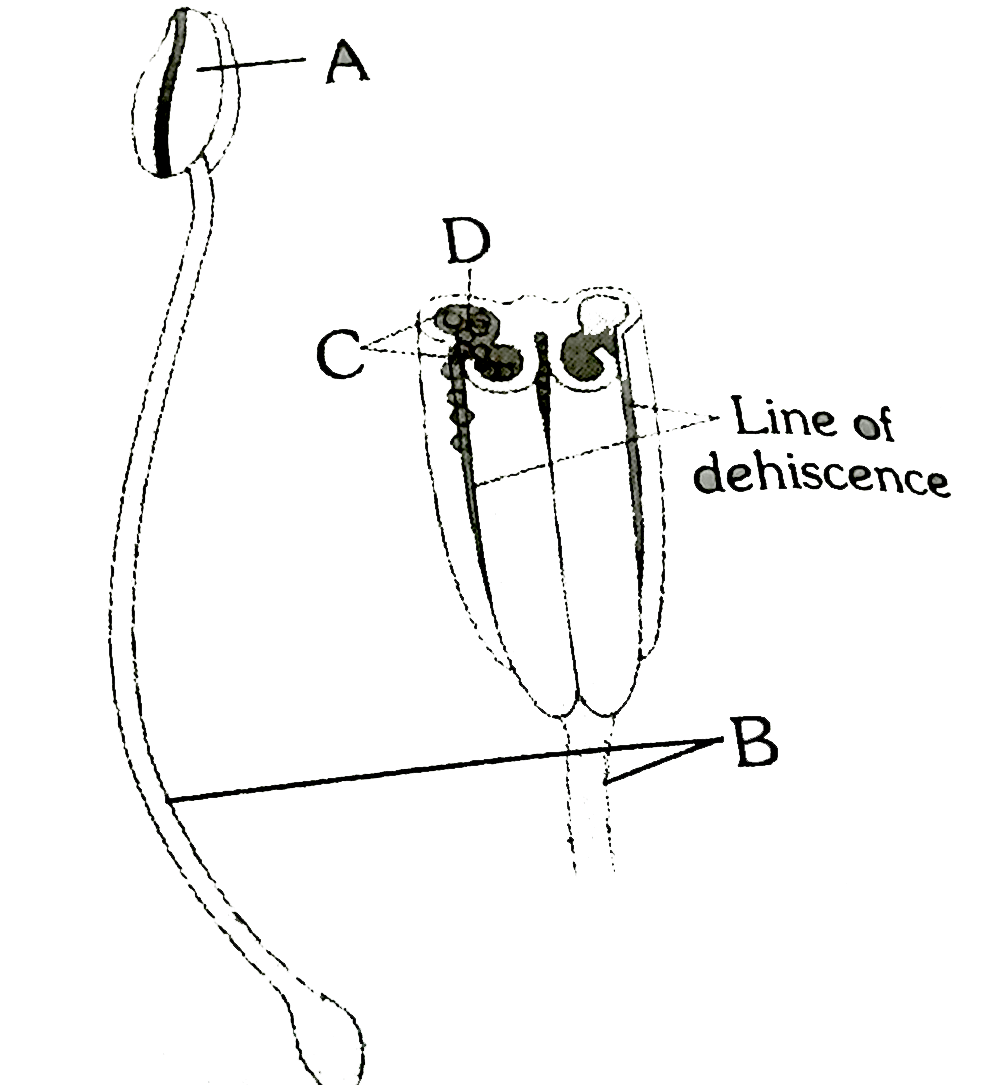 AA B C DAnther Filament Pollen sac Pollen grainsBA B C DAnther Pedicel Megasporangium Pollen grainsCA B C DAnther Petiole Megasporangium Pollen grainsDA B C DAnther Petiole Pollen sac Magaspore
The given figure shows the structure of a mitochondrion with its four parts labelled A, B, C and D. Select the part correctly matched with its function
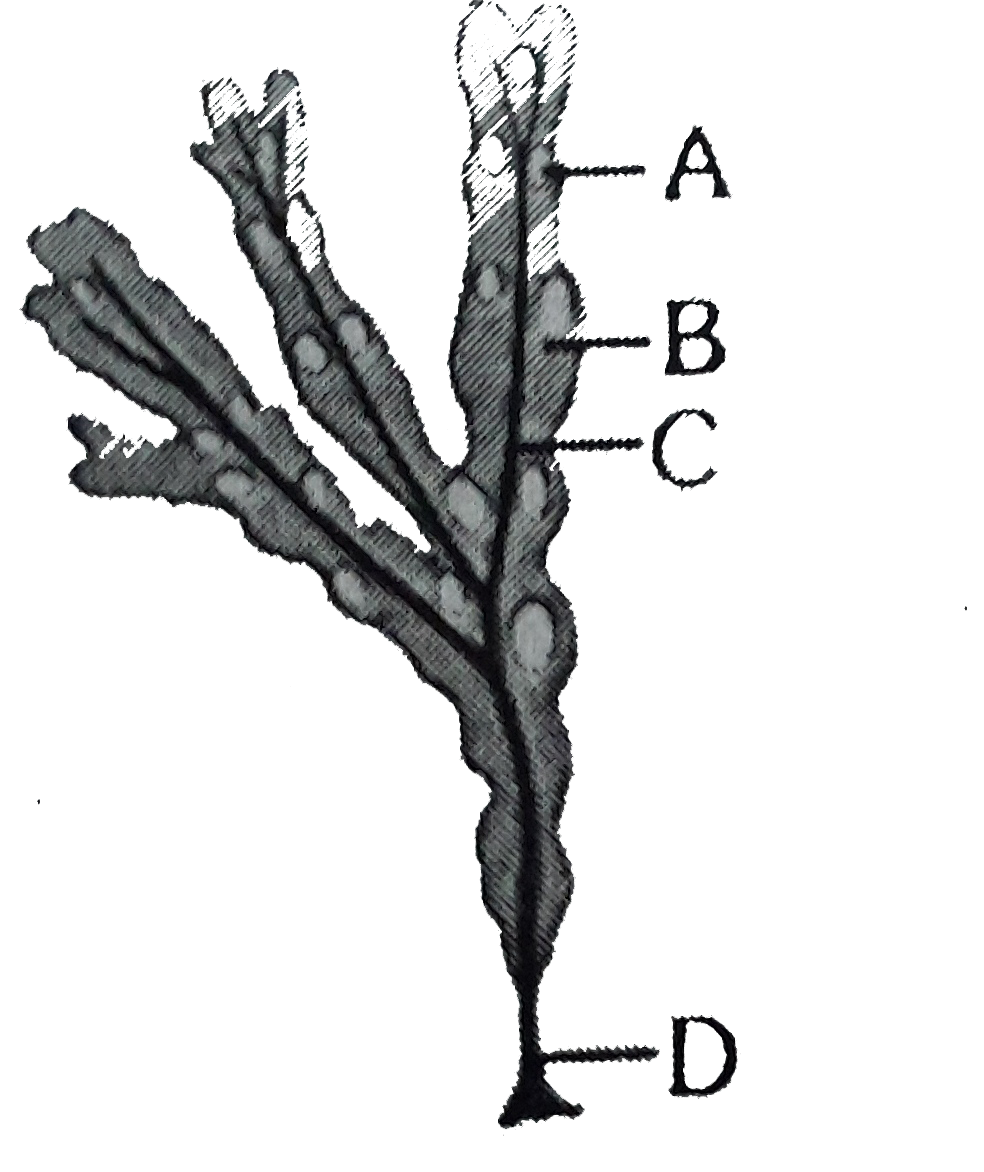
View SolutionIdentify the given figure with A,B,C & D:-
 .
.
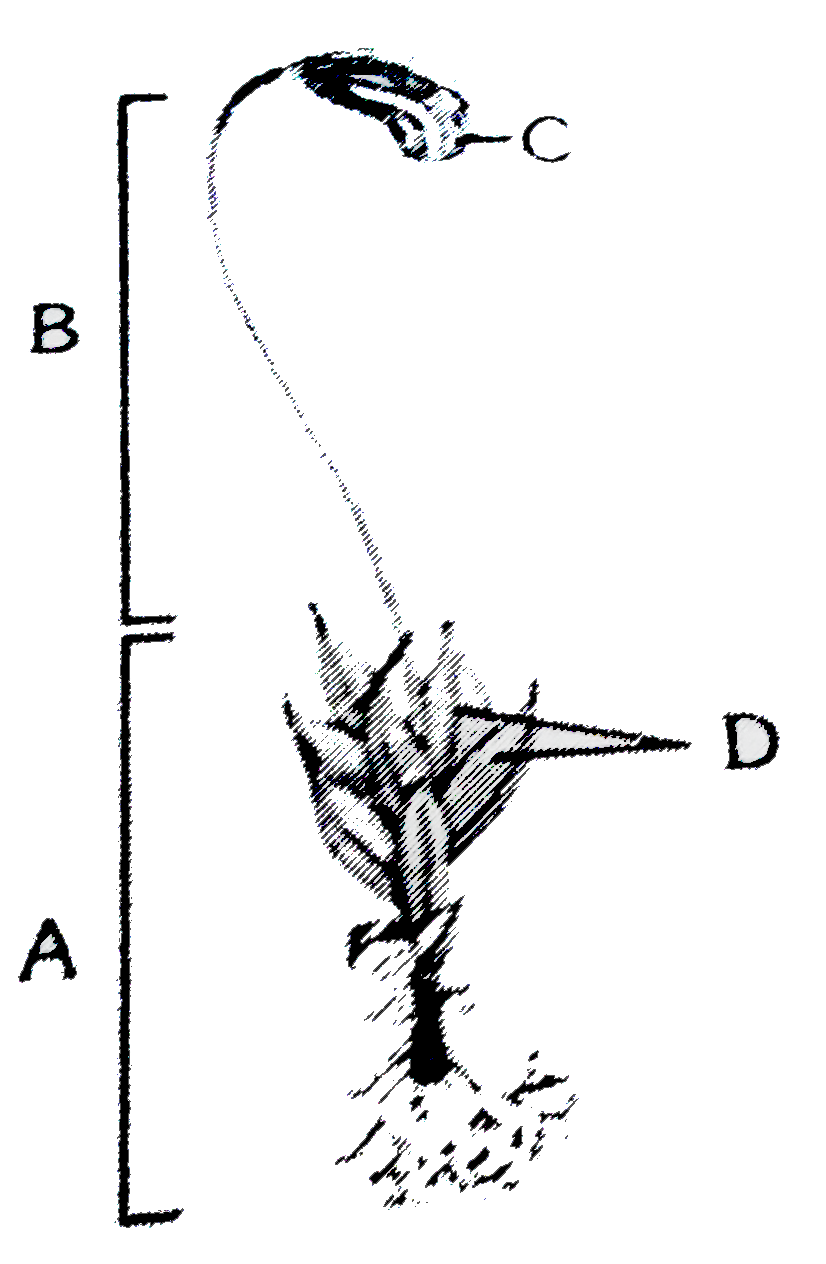
View SolutionIdentify the given figure with A,B,C & D
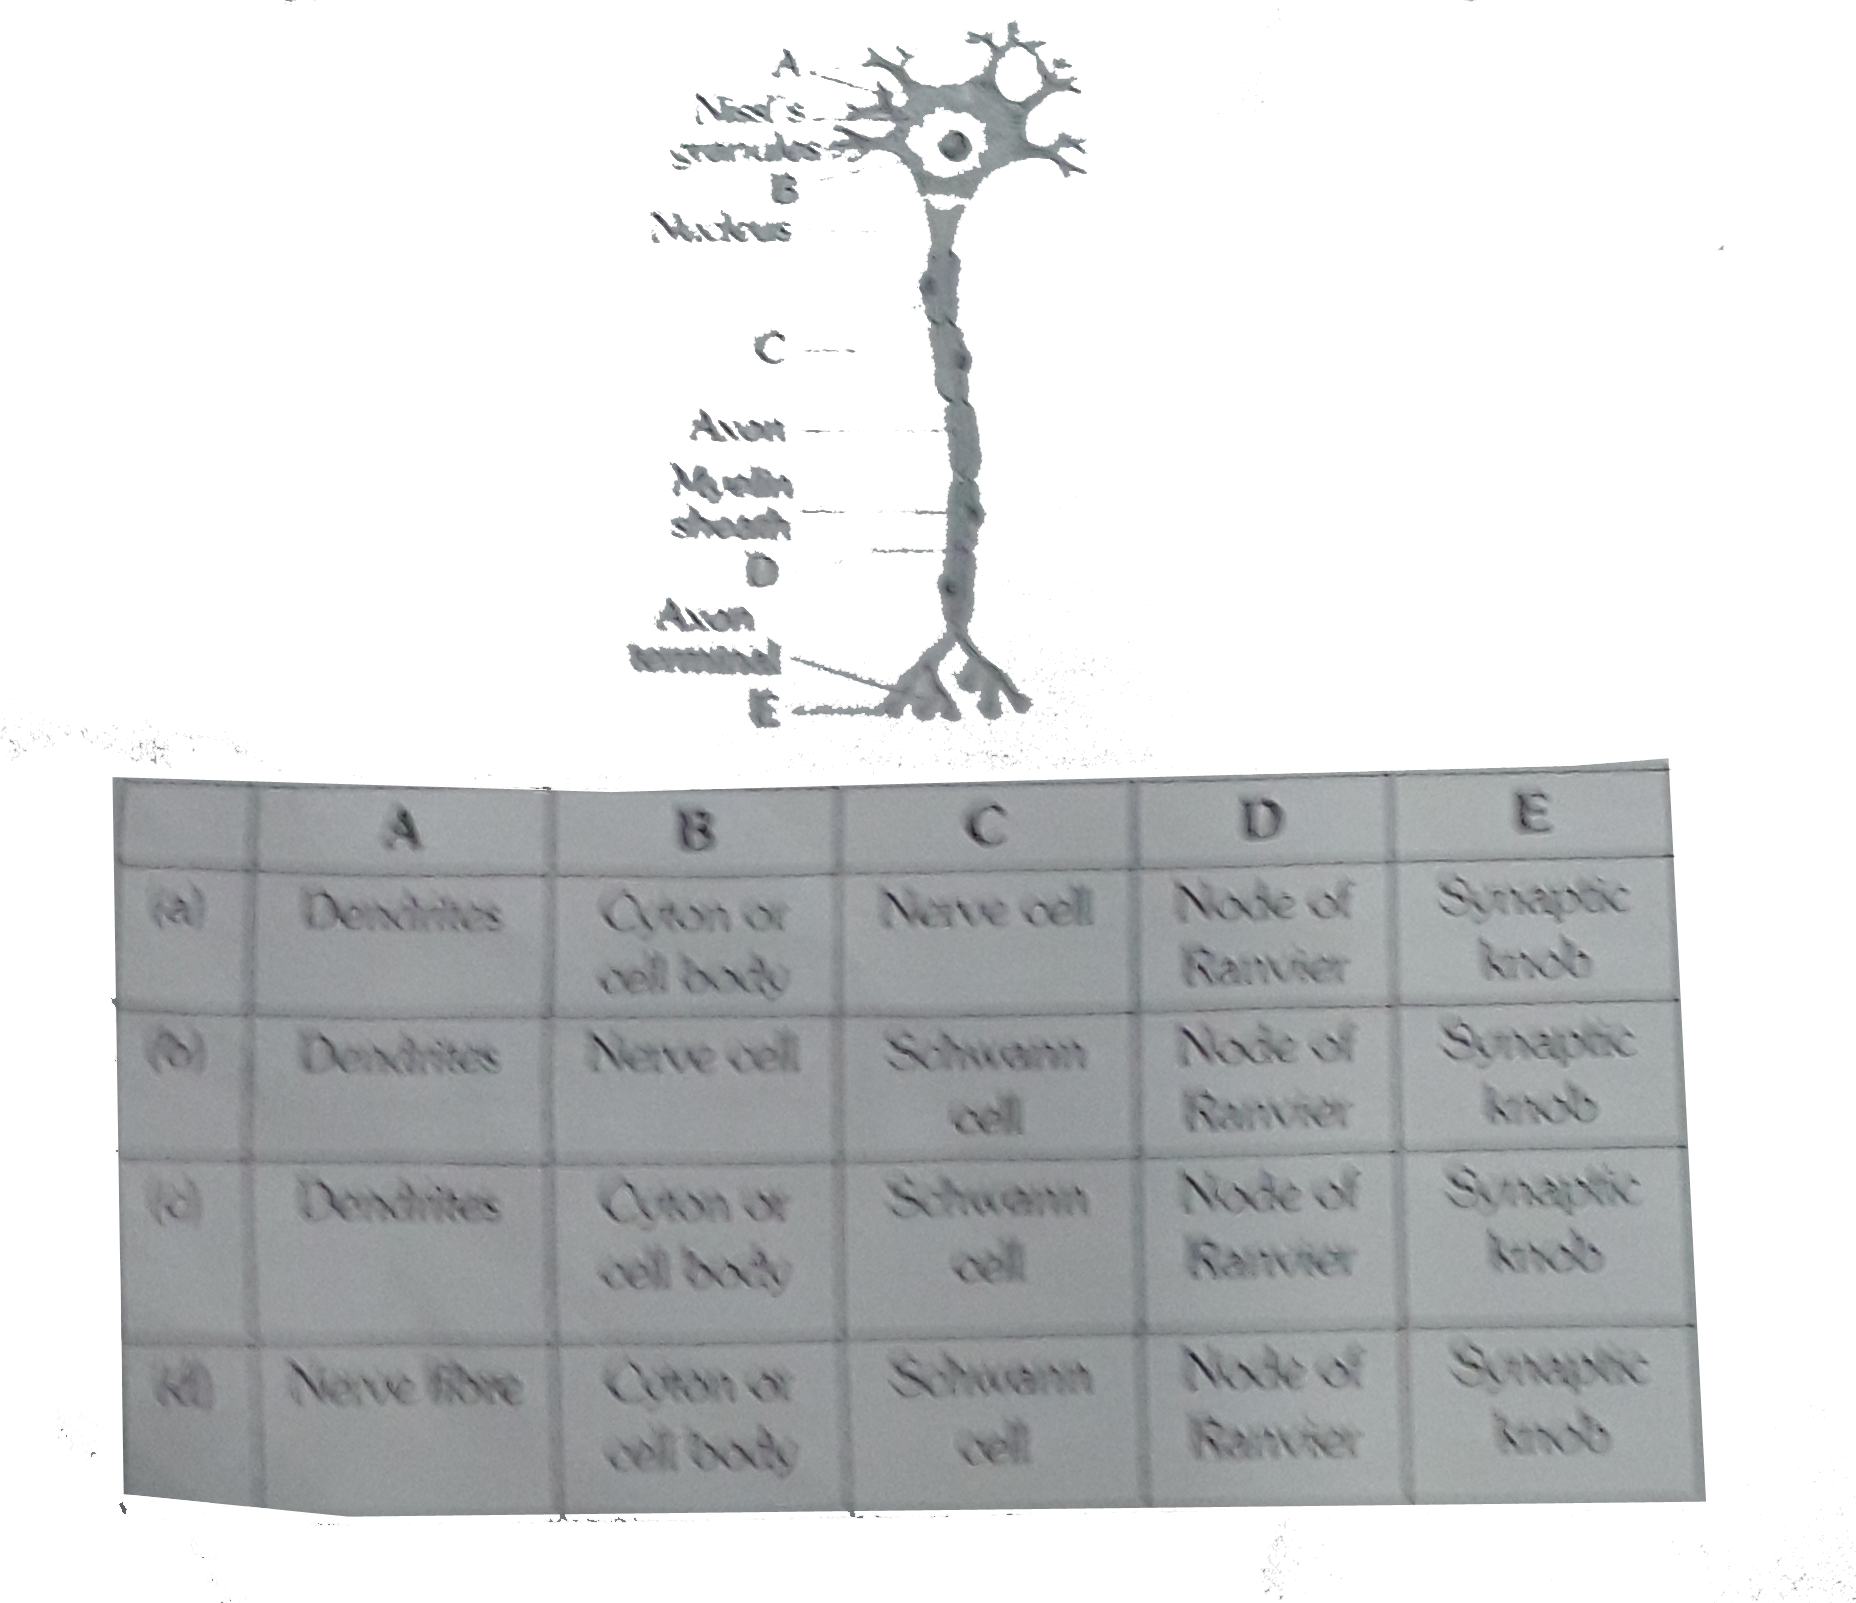
View SolutionThe given figure show the structure of neuron,Identify A,B,C,D and E
View SolutionThe following table shows the percentage of people having different blood groups. Draw a pie chart to represent the given data.
Blood groupABCDPercentage of people20452015
View SolutionIn the given figure, ∠B<∠Aand∠C<∠D. Show that AD<BC.
View Solution

