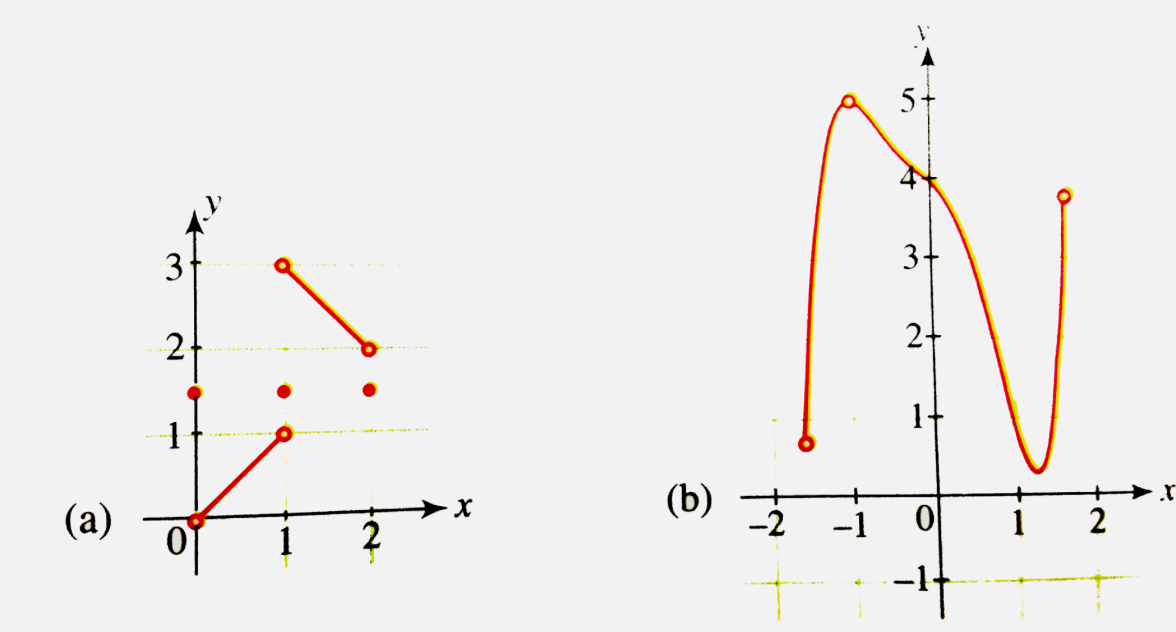
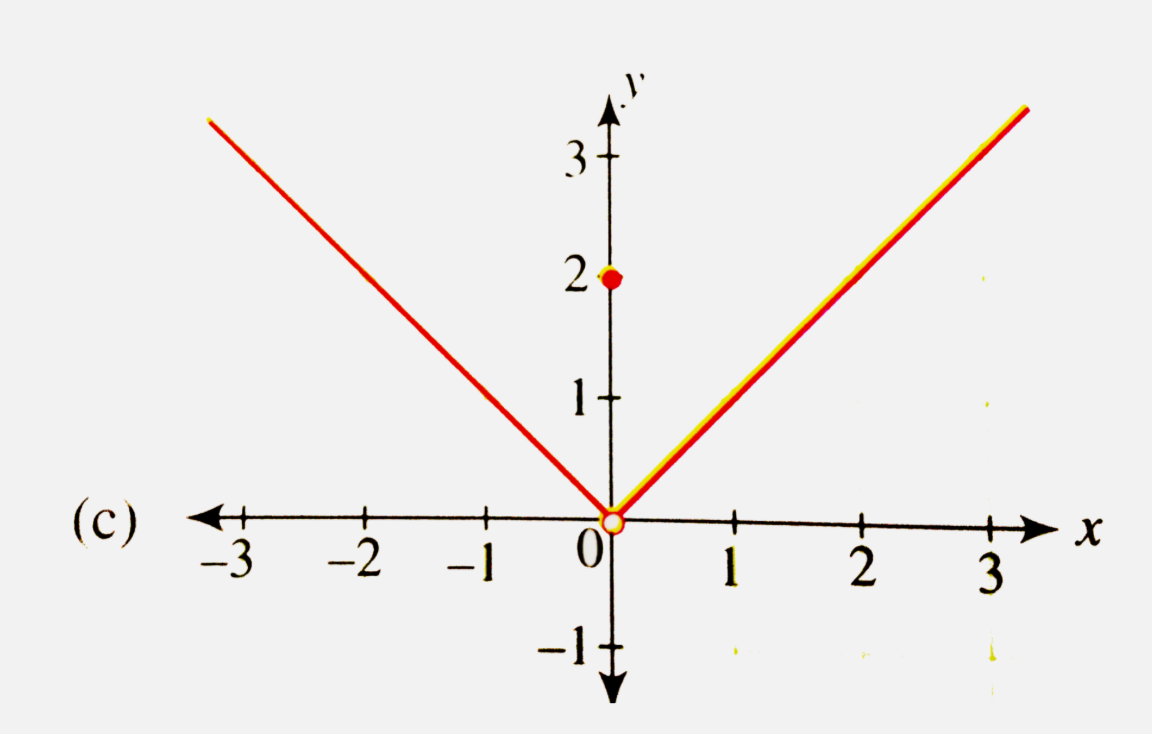
Given the graph of the function , draw the graph of .
 Solution in Bengali
x = 1, 4, 6 are the points of local maxima, and the local maximum values are .
x = 5, 7 are the points of local minima, and the local minimum values are .
x = 2 is the point of absolute minima and the local minimum value is f(2) = 0.
x = 8 is the point of absolute maxima and the absolute maximum value is f (4) = 5.
Topper's Solved these Questions
- GETTING STARTED WITH GRAPHSBOOK - CENGAGE PUBLICATIONCHAPTER - GETTING STARTED WITH GRAPHSEXERCISE - Exercises 1.14
1 Videos
- GETTING STARTED WITH GRAPHSBOOK - CENGAGE PUBLICATIONCHAPTER - GETTING STARTED WITH GRAPHSEXERCISE - Exercises 1.15
1 Videos
- GETTING STARTED WITH GRAPHSBOOK - CENGAGE PUBLICATIONCHAPTER - GETTING STARTED WITH GRAPHSEXERCISE - Exercises 1.12
1 Videos
- FUNCTIONSBOOK - CENGAGE PUBLICATIONCHAPTER - FUNCTIONSEXERCISE - Comprehension Type
7 Videos
- GRAPH OF INVERSE TRIGONOMETRIC FUNCTIONSBOOK - CENGAGE PUBLICATIONCHAPTER - GRAPH OF INVERSE TRIGONOMETRIC FUNCTIONSEXERCISE - Exercises
18 Videos
Similar Questions
Find the intervals in which f(x)=x2+2x−5 is increasing or decreasing.
View SolutionDetermine the local maxima and local minima of f(x)=x3−6x2+12x−8 is
View SolutionGraph of functions are given in the following figure. Check the functions for absolute extremum.


View SolutionLet f(x)=x2−2x−1∀x∈R.Letf:(−∞,a]→[b,∞), where a is the largest real number for which f(x) is bijective.
If f:R→R, then range of values of k for which equation f(|x|)=k has 4 distinct real roots is
View SolutionDraw the graph of y=tan−1x−cot−1x.
View SolutionDetermine the point of symmetry of a regular hexagon.
View SolutionDtermine the images of the following figure about the given line :
View SolutionDraw the bisector of ∠AOB=58∘
ltimg src="https://d10lpgp6xz60nq.cloudfront.net/physics_images/PS_MATH_VII_C05_S01_009_Q01.png" width="80%"gt
View SolutionMatch the following Column A to Column B

View SolutionMatch the following Column A to Column B

View SolutionMatch the following Column A to Column B

View SolutionThe inequation represented by the graph given below is :
View SolutionThe inequation that best describes the graph given below is _________
View SolutionThe inequation that best describes the following graph is _________
View SolutionWhich inequations represent the shaded region in the given figure
View SolutionIn Fig, find the value of x.
ltimg src="https://d10lpgp6xz60nq.cloudfront.net/physics_images/PS_MATH_IX_C12_S01_032_Q01.png" width="80%"gt
View Solution
