Graph of Linear polynomial
To plot the graph of a linear polynomial, we can follow these steps:
1. Identify the Linear Polynomial:
A linear polynomial can be expressed in the form f(x)=ax+b, where a and b are constants, and a≠0.
2. Set Up the Equation:
We can rewrite the polynomial in terms of y:
y=ax+b
3. Find Points for the Graph:
To plot the graph, we need at least two points. We can find these points by choosing values for x.
- Point on the X-axis:
To find the x-intercept (where y=0):
0=ax+b⟹ax=−b⟹x=−ba
This gives us the point (−ba,0).
- Point on the Y-axis:
To find the y-intercept (where x=0):
y=a(0)+b=b
This gives us the point (0,b).
4. Plot the Points:
On a Cartesian coordinate system, plot the two points:
- (−ba,0) on the x-axis.
- (0,b) on the y-axis.
5. Draw the Line:
Connect the two points with a straight line, extending it in both directions. This line represents the graph of the linear polynomial y=ax+b.
A linear polynomial can be expressed in the form f(x)=ax+b, where a and b are constants, and a≠0.
We can rewrite the polynomial in terms of y:
y=ax+b
To plot the graph, we need at least two points. We can find these points by choosing values for x.
To find the x-intercept (where y=0):
0=ax+b⟹ax=−b⟹x=−ba
This gives us the point (−ba,0).
To find the y-intercept (where x=0):
y=a(0)+b=b
This gives us the point (0,b).
On a Cartesian coordinate system, plot the two points:
- (−ba,0) on the x-axis.
- (0,b) on the y-axis.
Connect the two points with a straight line, extending it in both directions. This line represents the graph of the linear polynomial y=ax+b.
Similar Questions
Knowledge Check
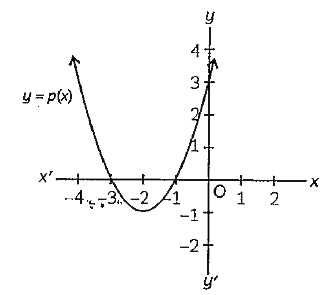
The graph of a polynomial p(x) is given in the figure.
What are the zeroes of polynomial from the graph
 A3 and 0B−3and−1C−3and0D−1and0
If a quadratic polynomial f(x) is a square of a linear polynomial, then its two zeroes are coincident. (True/false)
View SolutionWhat will be the number of zeros of a linear polynomial p(x) if its graph
(i) passes through the origin.
(ii) doesn't intersect or touch x-axis at any point ?
View SolutionGraph of cubic polynomial
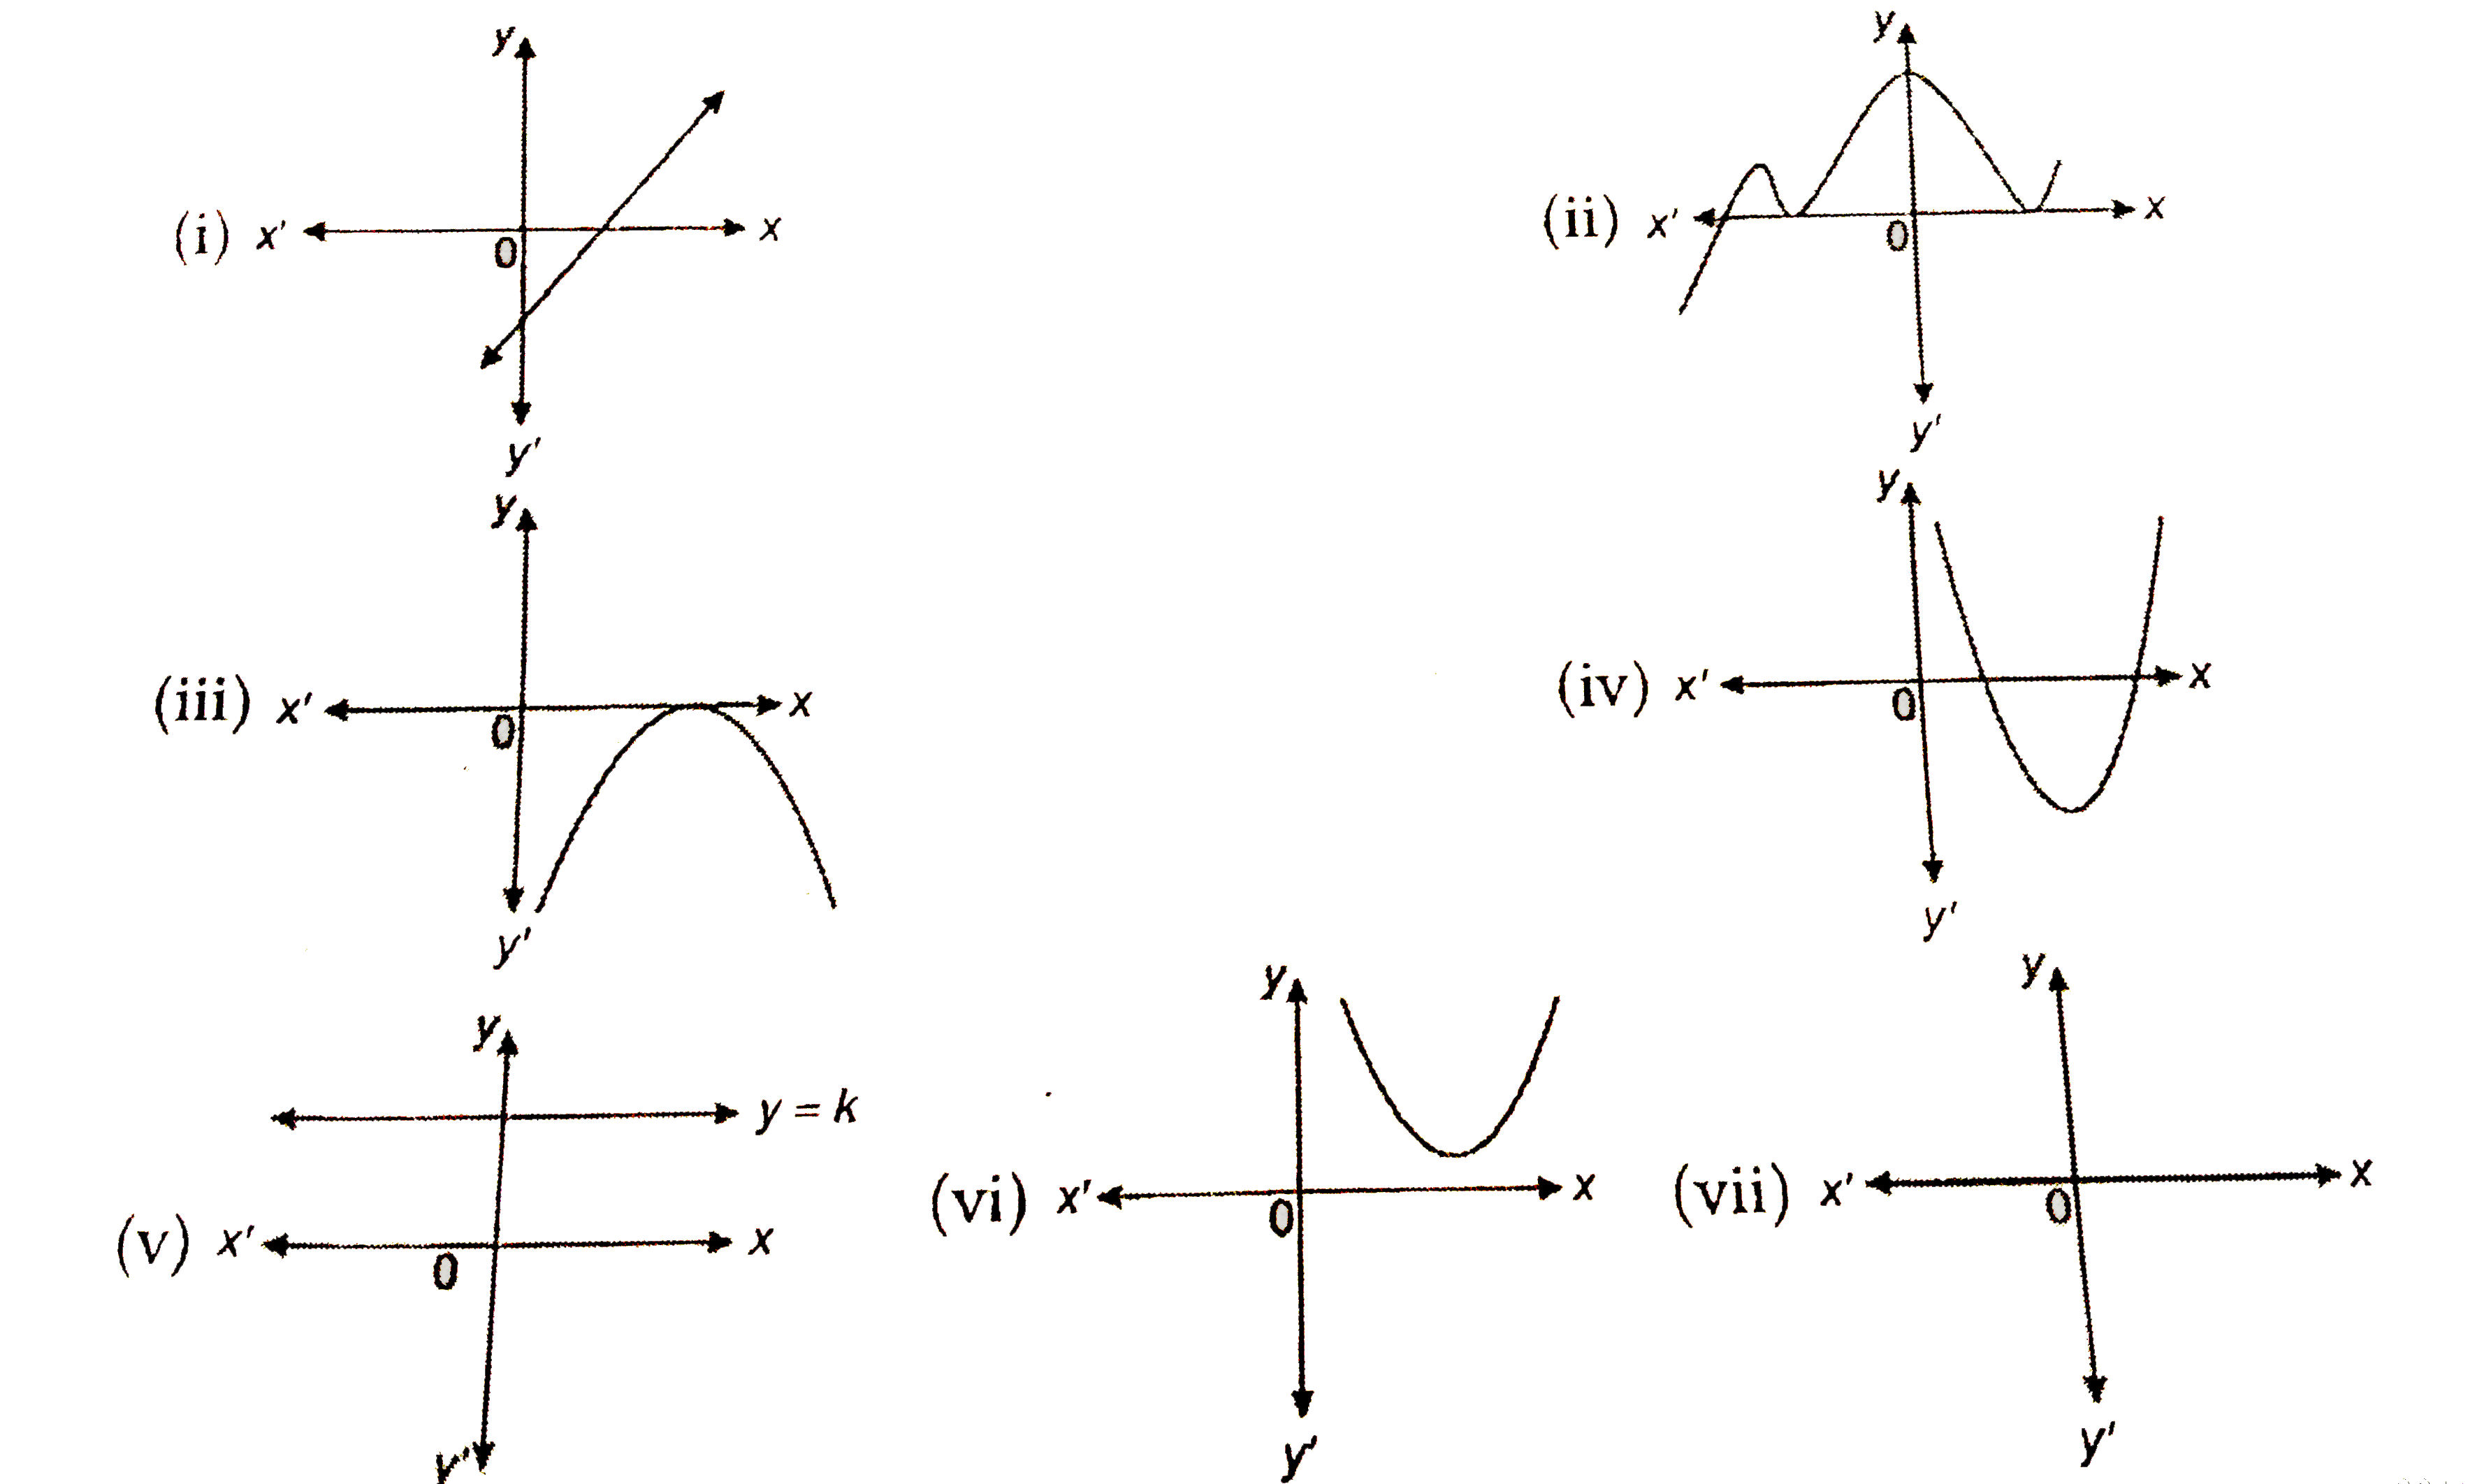
View SolutionWhich of the graphs given below corresponds to linear polynomial or a quadratic polynomial ? Also, find the number of zeroes of the polynomial in each case.

View SolutionIf each one of the following graphs is the graph of a polynomial, then identify which one corresponds to a linear polynomial and which one corresponds to a quadratic polynomial? (FIGURE)
View SolutionDraw the Graph of the Polynomial when roots of the polynomial is given .
View SolutionSteps to draw a graph of a polynomial
View Solution
