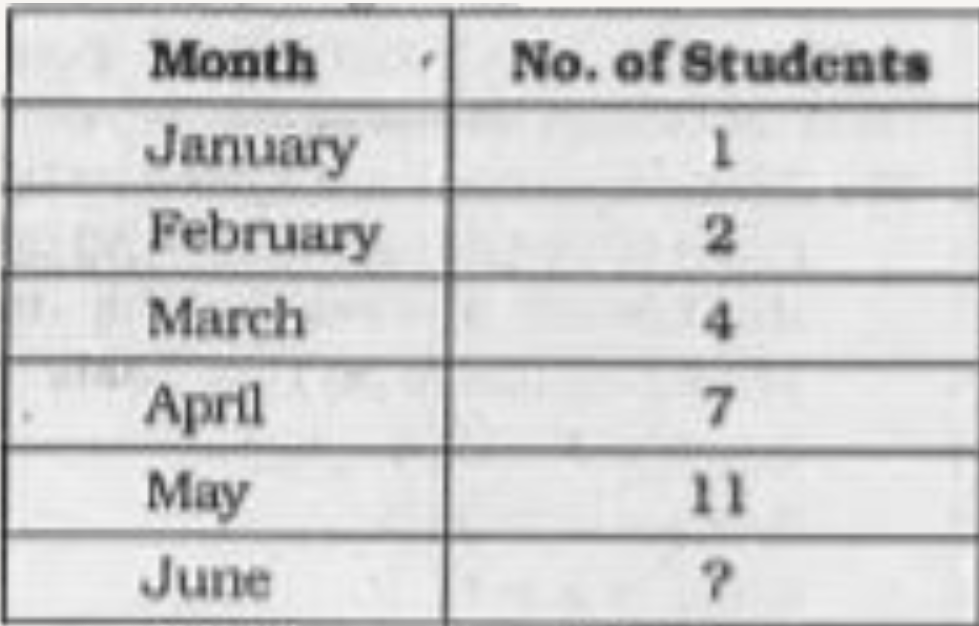
In a tree plantation programme, the number of trees planted by students of different classes is given in the following table. Draw a pie diagram showing the information.

Step by step video & image solution for In a tree plantation programme, the number of trees planted by students of different classes is given in the following table. Draw a pie diagram showing the information. by Maths experts to help you in doubts & scoring excellent marks in Class 10 exams.
Updated on:21/07/2023Topper's Solved these Questions
- STATISTICSBOOK - TARGET PUBLICATIONCHAPTER - STATISTICSEXERCISE - Problem Set-6
21 Videos
- STATISTICSBOOK - TARGET PUBLICATIONCHAPTER - STATISTICSEXERCISE - Practise Set 6.5
2 Videos
- SIMILARITY BOOK - TARGET PUBLICATIONCHAPTER - SIMILARITY EXERCISE - Chapter Assessment
19 Videos
- TRIGONOMETRY BOOK - TARGET PUBLICATIONCHAPTER - TRIGONOMETRY EXERCISE - Chapter Assessment
18 Videos
Similar Questions
The marks obtained by a student in different subjects are shown. Draw a pie diagram showing the information.

View SolutionThe marks obtained by a student in defferent subjects are shown. Draw a pie diagram showing the information.

View SolutionThe percentage of expenditure on different heads in a budget of a state is as shown below :

Draw a pie diagram to represent the information .
View SolutionTime alloted for the preparation of an examination by some students is shown in the table. Draw a histogram to show the information.

View SolutionTime allotted for the preparation of an examination by some students is shown in the table. Draw a histogram to show the information.

View SolutionTime alloted for all preparation of an examination by some students is shown in the table.Draw a histogram to show the information.

View SolutionIn a tree plantation programme, 40 students planted various number of plants . 8 students planted 5 saplings each. What is the percenteage of these students ? What is the percentage of the remaining students ?
View SolutionThe number of hours spent by a school boy in different activities in a day is given below:

Represent the above information using pie diagram.
View SolutionThe number of students in an art class is increasing month after month as follows. Find the number of students in June from the following information.

View SolutionOn an envirnoment day, students in a school planted 120 trees under plantation project. The information regarding the project is shown in the following table. Show it by a pie diagram.

View Solution
