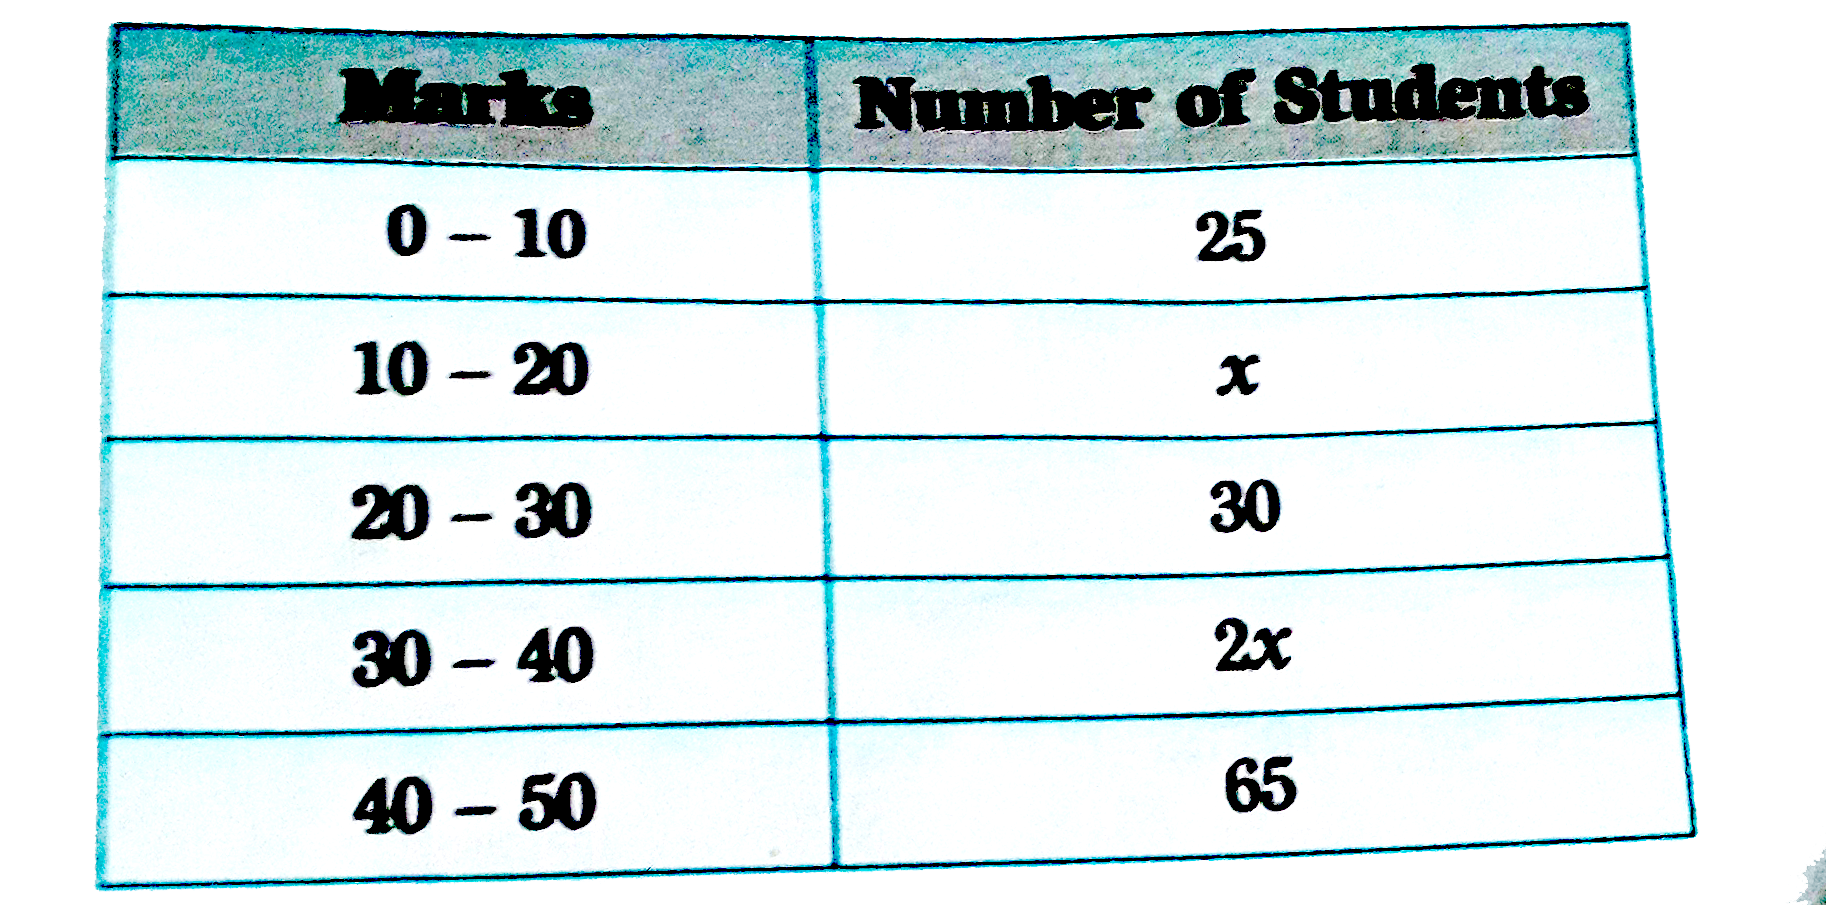
Time alloted for all preparation of an examination by some students is shown in the table.Draw a histogram to show the information.
Topper's Solved these Questions
- STATISTICS BOOK - UNIQUE PUBLICATIONCHAPTER - STATISTICS EXERCISE - PRACTICE SET 6.5
3 Videos
- STATISTICS BOOK - UNIQUE PUBLICATIONCHAPTER - STATISTICS EXERCISE - PROBLEM SET
6 Videos
- STATISTICS BOOK - UNIQUE PUBLICATIONCHAPTER - STATISTICS EXERCISE - PRACTICE SET 6.3
4 Videos
- SIMILARITYBOOK - UNIQUE PUBLICATIONCHAPTER - SIMILARITYEXERCISE - Assignment-I
5 Videos
- TRIGONOMETRYBOOK - UNIQUE PUBLICATIONCHAPTER - TRIGONOMETRYEXERCISE - ASSIGNMENT
12 Videos
Similar Questions
Time alloted for the preparation of an examination by some students is shown in the table. Draw a histogram to show the information.

View SolutionTime allotted for the preparation of an examination by some students is shown in the table. Draw a histogram to show the information.

View SolutionThe marks obtained by a student in different subjects are shown. Draw a pie diagram showing the information.

View SolutionThe marks obtained by a student in defferent subjects are shown. Draw a pie diagram showing the information.

View SolutionIn a tree plantation programme, the number of trees planted by students of different classes is given in the following table. Draw a pie diagram showing the information.

View SolutionIn a tree plantation programme, the number of trees planted by students of different classes is given in the following table. Draw a pie diagram showing the information.

View SolutionThe following tale gives the result of certain examination for 180 students. Find the value of x and draw histogram.

View SolutionThe following table shows the marks obtained by Sumit in the annual examination.

Draw a bar graph to show the above information.
View SolutionThe following table is based on the marks of the first term examination of 10th class students . Show the information by a histogram. Also, draw a frequency polygon with the help of the histogram :

View SolutionThe following frequency distribution table shows marks obtained by 180 students in Mathematics examination :

Find the value of x.
Also draw a histogram representing the above informations.
View Solution
